Monitoring the 2030 Agenda in Mexico:
Institutional Coordination and the Integration of
Information
Mexico is one of only two countries in the
world, together with Brazil, where the National
Statistical Office and the National Mapping
Agency have been integrated into a single
organisation. Established in 1983 and granted
constitutional autonomy in 2008, the National
Institute of Statistics and Geography (INEGI, by
its Spanish acronym) is the organisation in
charge of the production and coordination of
statistical and geographical information in
Mexico, thus allowing the development of both
disciplines in constant interaction.
Valuable feedback and benefits
between producers of official statistics and
geo-products, and the final users of such
integrated data, allow for the development of
better public policies, the monitoring of
international goals and agreements, such as the
SDGs, as well as swifter and more accurate
decision-making during disaster management
situations.
4.1 Institutional setting
In 2008, INEGI became the single
public agency responsible for coordinating and
regulating the newly-created National System of
Statistical and Geographical Information (SNIEG),
whose main function is to collect, process and
publish information of national interest, in other
words to generate, coordinate and disseminate the
nation’s official data. The SNIEG provides the
Mexican State, and society, with high quality,
timely and freely available information that can
aid in national development and other processes.
It produces statistical and geographic information
on all areas of sustainable development (economic,
socio-demographic, environmental and on government
and justice); disseminates it in a timely fashion;
promotes the knowledgeable use of such
information; and is responsible for storing and
preserving this information.
With all
the associated tools that this integration has
allowed, it is possible to geo-reference many
relevant statistics; determine the exact location
of economic, social and environmental issues and
needs, including the unveiling of otherwise hidden
inequalities and other complex interactions; and
monitor damage, rescue and recovery efforts
deriving from natural disasters and other
emergencies that help improve public programmes
and maximize resources for the overall benefit of
people and territory. The use of satellite
imagery, as well as other EO-derived data, has
been key in the geo-statistical integration
process and several tools have been developed to
aid in policy design and monitoring in all
dimensions of sustainable development.
Geo-statistical integration has
allowed for the development of a free and open
online platform, known as the Digital Map of
Mexico (MxSIG). This adaptable, user-specific
geo-statistical information integration and
visualization software features a built-in system
of international standards, is free to download
and use, and does not require additional
commercial software licenses. It allows the
visualization and analysis of geographic and
geo-referenced statistical information offering
208 vector data layers, with more than 71 million
geographic objects and 4 raster layers covering
the whole country, including geographical limits,
geodesy, water infrastructure, geographical names,
hydrography, terrain data, geographical addresses
and localities.
In addition to these institutional settings and
integrative tools designed to fulfil national
priorities, with the integration of statistics
and geography at its core, Mexico has undertaken
a state-wide effort for the monitoring and
fulfilment of the Sustainable Development Goals
(SDGs), through a National Council for the 2030
Agenda for Sustainable Development, coordinated
at the highest level by the Office of the
President and involving all relevant state
units, including line Ministries, Congress, and
state and municipal governments. This
cross-sector initiative includes an online
platform (www.agenda2030.mx) that includes
information on national SDG measurement and
monitoring progress. Currently, 25 SDG
indicators are ready to be measured at a
national level, with further additions and
updates expected on a regular basis. According
to a recent national crosscutting analysis,
there is sufficient – and consistent – data and
methodologies to adequately measure up to 94 SDG
indicators (i.e., considered as belonging to
Tier I according to the IAEG-SDG
classification), compared to 81 globally
according to the UN system. Also, upwards of 50
indicators have been identified at the national
level that could either directly benefit from
the contribution of geospatial information
and/or Earth observations (GI/EO), or complement
and enrich the information provided by
statistics and administrative records.
Based on the IAEG-SDG Global
Indicator Framework, a comprehensive analysis
has also delivered a list whereby both
geospatial and EO data can contribute to better
measurements (including transitioning from a
Tier III to a Tier II, or even a Tier I,
classification), either directly or indirectly.
A number of such examples are presented
herewith.
This national effort
follows Mexico’s international leadership on the
2030 Agenda follow-up and the use therein of
GI/EO. This includes the country’s active
participation in the multilateral negotiations
at the United Nations leading to the 2030 Agenda
and SDGs, as well as its current role, through
INEGI, as co-chair of the IAEG-SDGs and of the
IAEG-SDGs’ Working Group on Geospatial/EO
information. In this regard, Mexico’s
participation in the United Nations Committee of
Experts on Global Geospatial Information
Management (UN-GGIM), as well as in the Group on
Earth Observations (GEO) through its initiative
in support of the 2030 Agenda (EO4SDG), has been
particularly fruitful.
Furthermore,
a collaboration is currently underway between
Mexico (through INEGI and the Environment
Ministry SEMARNAT), the United Nations
Statistics Division (UNSD) and UN Environment on
the implementation of the System of
Environmental Economic Accounting – Experimental
Ecosystem Accounting (SEEA EEA), including the
use of EO and geospatial information in support
of the SEEA framework. A further article on this
topic may be found in Part II of this Handbook.
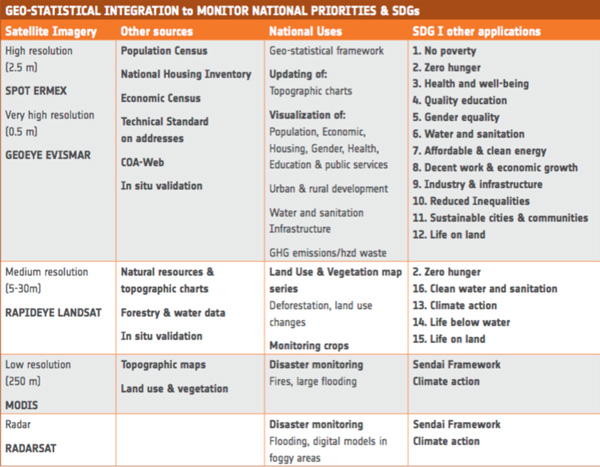
Table 1: Mexico’s integrated use of
geospatial/EO information and statistics to
monitor national and global indicators.
4.2 Measurement of specific SDG Indicators
using EO and GI
Indicator 9.1.1 – Proportion of the rural
population who live within 2 km of an all-season
road.
This indicator is derived using a
combination of statistical (Census Data, ITER
2010) and geographic data (National Topographic
Data Set, including transportation layers and
validation using satellite imagery).
Indicator 15.1.1 – Forest area as a proportion
of total land area
This indicator is derived entirely
from geospatial and satellite data. It uses five
datasets of land use and vegetation (derived from
remote-sensing images). The classification system
comprises 57 types of vegetation, including
temperate and tropical forests, grasslands,
shrubland, mangroves and other categories, such as
agricultural and built-up/urban areas.
Indicator 15.3.1 – Proportion of land that is
degraded over total land area
According to the UN Convention to
Combat Desertification (UNCCD), this indicator is
defined as the amount of land area that is
degraded. Its measurement unit is the spatial
extent expressed as the proportion of land that is
degraded over total land area. Indicator 15.3.1 is
derived by summing all those areas subject to
change, whose conditions are considered negative
by national authorities (i.e., land degradation)
while using ‘good practice guidance’ in the
measurement and evaluation of changes to each of
the following three sub-indicators:
i.
Land cover and land cover change, which can be
derived from the land cover and vegetation time
series, as described for indicator 15.1.1 (see
above). In Mexico, these indices are already being
calculated for national reports on carbon
emissions due to land cover/use change, as well as
on reports on deforestation by the FAO’s Global
Forest Resources Assessments (FRA).
ii. Land productivity, which is
calculated using the normalized difference
vegetation index (NDVI), a simple graphical
indicator that can be used to analyse
remote-sensing measurements, typically from a
space platform, and assess whether the target
being observed contains live green vegetation or
not. In Mexico, this index is calculated using
MODIS, Landsat and Sentinel satellite imagery,
which acquire data in visible and near-infrared in
plant reflectance to determine spatial
distribution.
iii. Carbon stocks above
and below ground, calculated using digital mapping
from organic carbon content in soil samples,
together with field data from around 20,000 soil
profiles in Mexico’s National Forest and Soil
Inventory (INFyS) by the National Forestry
Commission (CONAFOR).
All indicators
related to land cover, land use, land degradation,
agricultural area and the like benefit both from
the Land Use and Vegetation Chart Series (scale
1:250,000) mentioned earlier and from the National
Forest and Soil Inventory
(www.cnf.gob.mx:8090/snif/portal/infys).
The INFyS is updated yearly (and
completely every five years) using satellite
imagery and field data, including GPS and
photography, through the measurement of over 170
variables. Data collection in the field is the
systematic stratification of over 26,000
conglomerates (from over 81,000 sampling sites),
covering all climates and vegetation in the
country. This information is combined with data on
roads, watersheds, climate, soils, natural
protected areas and various forest inventories.
Forest monitoring involves the interpretation of
MODIS satellite images by means of specialized
software, and supported by the field work for the
INFyS, to determine the dynamics of changes in
vegetation every year.
4.3 EO/GI in the monitoring of other processes
for the 2030 Agenda
Disaster risk reduction
When disaster strikes, geospatial
information becomes a critical asset for actions
that can mitigate its effects. This information
should be timely, accessible and of adequate
quality to offer the best response possible.
To ensure the availability of this
information in Mexico, INEGI has put into
operation a collaborative online platform for
disaster response, the Collaborative Site for
Disaster Response, where the relevant state
agencies can exchange information to perform their
respective functions in a more timely and
efficient manner.
The collaborative site is a restricted
access website for users at several government
agencies ranging from those related to the
production of disaster-related geospatial and
statistical information to those directly in charge
of the emergency response. These include the
Interior, Transportation, Environment, Energy,
Agriculture, Army and Navy ministries, among other
entities, coordinated by the Disaster Prevention
Centers and the Civil Protection System.
Once an authorized user gains access to
the main page, the following sections are displayed:
Recent Events, Historic Events, Available
Information, News, and Contact Information.
The section on Recent Events contains
information related to disaster events where the
response is on-going or has occurred within the past
year. Each event can be considered as a ‘sub-site’
within the main site. Access is given to relevant
datasets, either through links to downloadable files
or the URLs to Web Map Services. Examples are
population (census) data at the street block level
for towns or cities in the affected area,
hydrographic networks, road networks and satellite
imagery, both prior to the event and, whenever
possible, in the hours or days after the event so
that affected areas and features can be located.
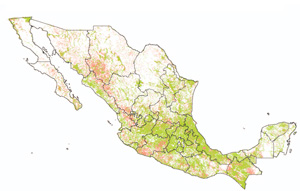
Figure 1: Calculation of SDG indicator 9.1.1
(Proportion of the rural population who live
within 2 km of an all-season road), using
census, topographic, road and satellite data.
Green: populated places within 2 km of an
all-season road. Pink: populated places further
than 2 km from an all-season road.
A specific message board is created for
each event, so that multiple users can exchange
comments, questions and experiences. There is also a
section for data visualization.
The
Historic Events section provides access to data sets
related to events that happened in previous years or
where the emergency phase has ended. The general
structure of this section is the same as that for
recent events.
As a disaster may occur
anytime and anywhere in the country, the Available
Information section gives permanent access to some
basic – or framework – data sets. Access to this
information is through downloadable links or URLs to
Web Services: Web Map Services, Web Feature Services
and Web Coverage Services.
This
multi-user data-sharing platform relies on satellite
optical and radar data, along with other EO sources.
Different types of satellite data are acquired in
consideration of the type of disaster and
meteorological conditions. Optical data is used for
fires, earthquakes, volcanoes, floods and
landslides. Before/after images are mainly supplied
by the Army and Navy, as well as by drones from the
Disaster Prevention Center (CENAPRED), and
supplemented by private providers, which are
regulated through flying permits.
Radar
data are used for floods, landslides and
earthquakes, and for all of the above in case there
are no conditions for optical imaging. Vertical
displacements are identified using interferometry.
Also, Global Navigation Satellite System (GNSS) data
is used to quantify land displacements after
earthquakes. Additionally, volunteered geographic
information (VGI), in the form of geo-tagged
photographs and other types of geo-referenced
citizen data, is incorporated to the site after
proper validation and can prove particularly
valuable, especially in cases where communications
have been affected or an affected site has been
isolated after a disaster.
This platform
has been instrumental during past emergencies, such
as when hurricanes Ingrid and Manuel struck the
Atlantic and Pacific coasts of Mexico within a
24-hour period in September 2013. More recently, it
proved key during the response to hurricanes
Franklin, Katia and José, as well as several
powerful earthquakes affecting southern states and
Mexico City in September 2017.
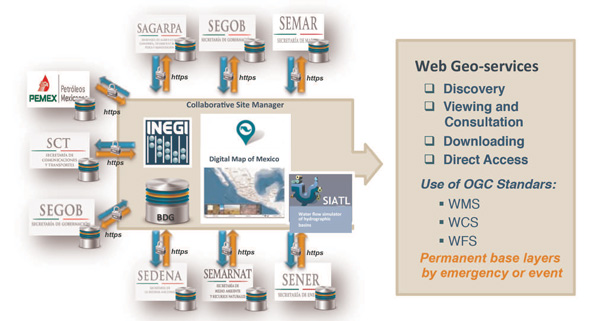
Figure 2: Overview of the national
collaborative site for disaster response and
preparedness, including coordinated data inputs
from relevant agencies for recent and historic
events.
4.4 National Gender Atlas
This is an online platform aimed at
gathering, integrating and visualizing, in a
geographic context, some of the most outstanding
socio-demographic and economic indicators with a
gender perspective, to make visible not only the
gender differences but also the additional
differences derived from their geographical
location disaggregated at the state level of the
national territory. Maps that show the behaviour
of demographic, social, work, time use,
entrepreneurship, poverty, decision-making and
violence against women, related to human rights
and with issues of public interest, are easily
accessed on the portal
(http://gaia.inegi.org.mx/atlas_genero).
The Gender Atlas derives from a
collaborative agreement between INEGI, The
National Women’s Institute (INMUJERES), UN Women
and the UN Economic Commission for Latin America
and the Caribbean (UN ECLAC). Launched in 2016, it
is oriented towards policy analyses that derive in
substantive gender and regional equality. It is
presented as an online platform for easy access
and visualization of the issues addressed. It
contains both statistical data and references to
the sources of the indicators that are presented
on the maps.
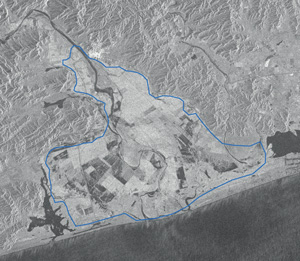
Figure 3: Radarsat image acquired after
Hurricane Patricia made landfall in the state
of Colima, on October 24th 2015. The blue
polygon shows a flooded area, mostly cropland,
around the Marabasco river.
Currently, the site includes 78
national indicators related to gender statistics,
including SDG 5 indicators on gender equality.
Metadata include methodological aspects and
geographic disaggregation. The information of the
Gender Atlas will be updated and expanded on a
permanent basis, considering new statistics as
well as national planning and government
programmes and policies and international
agreements linked to the empowerment of women and
equality between women and men. Efforts are
underway to develop similar platforms in other
Latin American countries, which would be linked
and interoperable for cross-regional analyses. Its
multi-dimensional nature will ensure that gender,
as envisioned in the SDGs, will be addressed in a
cross-cutting and integral way, considering its
social, economic, political, administrative,
environmental and geographical aspects.
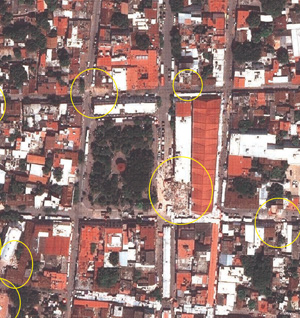
Figure 4: Drone image over Juchitan, Oaxaca,
showing collapsed buildings after the 8.1
magnitude earthquake on 7 September 2017.
4.5 Conclusions
– Geospatial Information, Earth
Observations, Big Data and Statistics can and should
be integrated in support of national policies and
the implementation of international agreements.
Efforts should be made at the national, regional and
global levels to generate collect and curate these
sources of information in a high-quality and
consistent manner for their systematic use in
complementing official statistics/information in a
sustainable manner.
– Geospatial
information facilitates the monitoring of social,
economic and environmental indicators to support,
design and monitor public policies.
–
Integration facilitates location of needs,
assessment of policy/global goals (such as the
SDGs), as well as progress over time.
–
Institutional capacity and inter-institutional
coordination, including with non-state actors such
as the private sector, academia and civil society,
are key in order to focus skills and resources,
avoid duplications and effectively use all pertinent
tools to achieve priorities.
–
Participation from all sectors of society is key,
including academia, civil society and the private
sector.
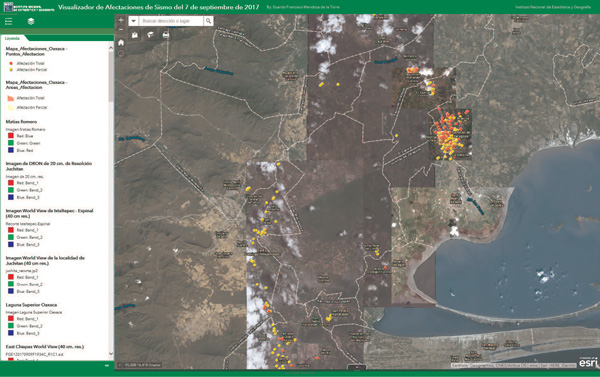
Figure 5: Mapping of affected areas in Oaxaca
City, Mexico after the 8.1-magnitude
earthquake on September 7 using satellite
images from different sources (visualization
within the Collaborative Site for Disaster
Response).
Article Contributors
Rolando Ocampo, Francisco Jimenez-Nava, Eduardo de
la Torre (Instituto Nacional de Estadística y
Geografía, INEGI; Mexico)