Ecosystem accounting is a new and emerging area
of statistics that can inform the 2030 Agenda
for Sustainable Development. The System of
Environmental-Economic Accounting (SEEA) Central
Framework, adopted as a statistical standard in
2012, measures how the economy uses the
environment as input in the production process
through the extraction of natural resources, how
it impacts the environment through the release
of emissions to water and air as well as solid
waste. The SEEA Central Framework is
complemented by the SEEA Experimental Ecosystem
Accounting (SEEA EEA), which measures the
functioning of ecosystems in relation to human
activities.
This article provides
examples of how the integration of EO data with
statistical data in an internationally agreed
statistical framework underpinned by an agreed
system of classifications for land cover, land
use and ecosystem types ensures coherent,
consistent and comparable measures. This in turn
has an impact on the derived indicators,
including the SDG Indicators, which are accurate
and comparable over time and across countries.
In particular, it provides examples on compiling
ecosystem extent, carbon and water accounts.
2.1 Introduction
The SEEA EEA, ecosystem accounting in
short, presents the basic accounting framework to
measure the extent and condition of ecosystems and
the flows of ecosystem services to the economy
and, broadly, to humanity. Together, the SEEA
Central Framework and the SEEA EEA provide a
coherent and integrated approach to the assessment
of the economy-environment nexus, thus providing
an important framework in support of sustainable
development analysis and policies.
Ecosystem accounting is unique in the
spatial or geospatial reference it provides to the
accounts. It has been made possible by the ease of
access and use and increased accuracy of a range
of spatially explicit data sources, such as EO
data, in the form of satellite and aerial images,
among others. The EO data combined with the
accounting structure facilitates the integration
of environmental information with economic
statistics to depict the contributions of the
ecosystems and the impacts of economic activities
on the ecosystems. They give an indication of the
extent and condition of – and services provided by
– ecosystems, contributing to the decision-making
on ecosystem management, including the allocation
of resources to preserve or improve their status.
Ecosystem accounting can be undertaken at any
scale – country, region, province, river basin,
protected area and so on. However, the link with
the economic accounts can only be done at scales
where economic information is available.
2.2 Ecosystem Extent Accounts
Ecosystem extent accounts organise
information on the extent or area of the different
types of ecosystems that exist within a country or
region. Land cover data, classified according to
the SEEA Central Framework standard classification
and complemented by additional characteristics
such as land use, elevation and ecosystem services
provided, helps to further classify the land
according to ecosystem types. Land cover accounts
are directly linked to several SDG Indicators,
including Indicator 15.3.1 on land degradation,
Indicator 6.6.1. on freshwater ecosystems, or
Indicators 11.3 and 11.7 on land use. Ecosystem
extent accounts supporting these Indicators are
usually compiled by using EO data combined with
statistical observations and ground truthing.
Examples in Brazil and Nepal of land cover and use
accounts are provided below. Additional examples
are provided by Mexico in their article in this
Handbook. The ecosystem extent account in Mexico
is used in support of providing information for
the monitoring of SDG Indicators 15.1.1 and
15.3.1.
Example 1: Land-cover and land-use changes in
Brazil
The Brazilian Institute of Geography
and Statistics (IBGE) has carried out a project
using EO techniques to detect changes in
land-cover and land-use. These changes are
represented through the change in proportion of
cover and use classes measured in time and space.
Tracking these changes over time provides an
analysis of the changes in the extent of ecosystem
assets, changes in landscapes and the impact of
such changes on the provision of ecosystem
services.
The work involved the
acquisition, conversion, enhancement, segmentation
and classification of MODIS (Moderate Resolution
Imaging Spectrodiameter) images with 250m
resolution, from the TERRA and AQUA satellites.
Subsequently, matrix editing to correct possible
imperfections required the use of other sources of
information, such as thematic maps and statistical
data, as well as input of data on deforested areas
and data from the agricultural census.
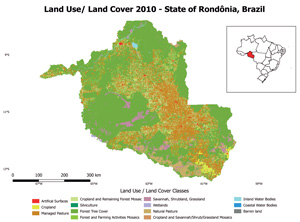
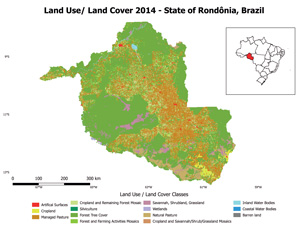
This work produced three land-cover
and land-use maps for the three periods analysed
(2000–2010, 2010–2012 and 2012–2014) and class
changes by overlying these maps. The class changes
allow tracking and analysing changes of overall
classes or transition between specific classes.
Figure 2 shows the land-cover/land-use map of the
State of Rondonia in Brazil for 2010 and 2014.
Figure 2: Land-cover/land-use in the State of
Rondonia, Brazil. Source: Brazilian
Institute of Geography and Statistics (IBGE),
2017
Example 2: Land cover in Nepal
Nepal is landlocked and challenged by
many environmental concerns that are directly
related to its topography, including
deforestation, natural disasters, climate change
and urbanisation. With the technical assistance of
the Economic and Social Commission for Asia and
the Pacific (UNESCAP), the Central Bureau of
Statistics (CBS) has developed land and forest
accounts based on the SEEA for 1990, 2000 and 2010
in order to understand and manage the
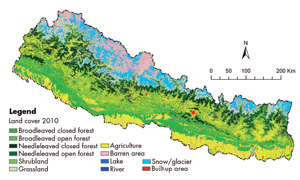
environmental impacts. The existing land-cover
maps were produced by the International Centre for
Integrated Mountain Development (ICIMOD) by
locally correcting Landsat satellite imagery from
1990, 2000 and 2010. Efforts are currently under
way to address some discrepancies that were
identified between the maps and the official total
land area of the country. These discrepancies
could be caused by the EO maps being collected
during different times of the year, thus making
the representation of the regression of glaciers
unreliable, and the use of different concepts and
classifications when the various maps were
produced. An interdepartmental working group was
established with the objective of adopting common
concepts and classifications on
land-cover/land-use and developing an agreed
single map at the country level.
Figure 3: Land-cover map of Nepal. Source:
Uddin et al. 2014
2.3 Water accounts
The SEEA EEA includes thematic
accounts for water, carbon and biodiversity.
Thematic accounts are compiled across different
ecosystem types to support assessments for
specific management purposes including land
management and planning, and water resource
management.
Ecosystem services
related directly to water include the
provisioning of water, in terms of volume of
water used for different purposes (e.g.,
drinking, irrigation, cooling, hydropower
generation, etc.); water regulation (e.g.,
filtering pollutants or regulating water flow);
and cultural services such as for recreation
(e.g., swimming, boating). This information is
of crucial importance for the monitoring of SDG
6 on water availability and sustainable
management of water. The example in the
Netherlands shows how water accounts can support
the monitoring of Target 6.4.
Example 3: Monitoring of Target 6.4
in the Netherlands
Indicators in
relation to SDG Target 6.4 focus on water use
efficiency (6.4.1) and water scarcity (6.4.2).
Data for these two Indicators can be obtained
from different sources, among them statistical
sources, model-based data and EO data. In
particular, the estimation of actual
evapotranspiration (AET) is quite important for
the measurement of water-related SDG Indicators,
including measuring water use in agriculture and
the availability of water. AET is defined as the
sum of evaporation and plant transpiration from
Earth’s surface to the atmosphere and it can be
calculated using algorithms that use EO data as
a source.
In order to assess AET, a
range of remote-sensing data is freely available
(e.g., MODIS, Landsat, Proba-V and Sentinel-2),
and several AET databases have been developed,
such as MOD16 (NASA) and the Land Surface
Analysis Satellite Applications Facility (LSA
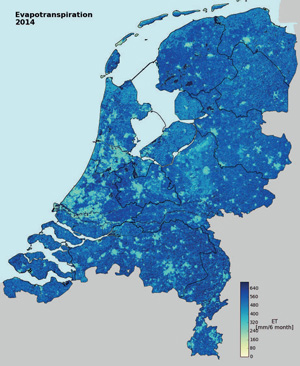
SAF). Statistics Netherlands has partnered with
eLEAF, an EO analysis company, to produce an AET
map for the Netherlands in order to obtain
spatial and temporal resolution that is superior
to data sources in the public domain. The
resulting map is shown in Figure 4.
Figure 4: Actual evapotranspiration (in mm)
for the Netherlands at a 250m resolution. Source:
Graveland et al., 2016
2.4 Carbon accounts
In the SEEA EEA, the scope of carbon
accounting encompasses measurement of carbon
stocks and flows for all parts of the carbon
cycle and carbon pools. The measurement of
stocks and flows of carbon can support
discussion of many policy-relevant issues,
including the analysis of greenhouse gas
emissions, use of energy and extent of
deforestation. As such, carbon accounting
supports the measurement of several of the SDG
Indicators, including Indicator 15.3.1 that
specifies carbon stocks as one of the aspects of
degradation of land. Carbon accounts can be
compiled using existing land-cover maps, but
also directly using EO data by using the
Normalized Difference Vegetation Index (NDVI) or
other techniques.
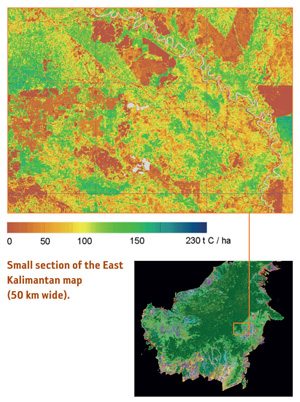
Recent
methodological developments in remote-sensing
techniques allow measurement of carbon stocks as
well as changes in carbon stocks directly with
adequate accuracy (see Figure 5). Such
approaches may be important when alternative
data sources and ground truthing is sparse.
Figure 5: Biomass and carbon monitoring
using EO data. Source: SarVision,
2012
2.5 Conclusion
The examples above demonstrate that
EO data are an important source in the
construction of ecosystem accounting. The
availability of EO data and its alignment with
the requirements of environmental-economic
accounting would further improve the access and
use of EO data and would also improve the
quality of ecosystem accounts. The growing
partnership among the various communities of
statisticians, Earth observation and geospatial
specialists, scientists and economists will
further improve the development of standards and
in turn the usability, quality and policy
relevance of data.
There is also
scope for joint development of tools and
standards, such as classifications and open
source software tools to assist countries with
the capture, processing and integration of data.
The use of EO data for land-cover accounts would
benefit from common land classifications agreed
by various communities. In this context, the
statistical community has on its research agenda
the finalisation of the proposed preliminary
classification of land-cover as well as the
development of a system of classifications
including land-cover, ecosystem types and
ecosystem services, taking into consideration
existing approaches and availability of source
data, especially that from EO. This work is
being undertaken as part of the international
revision process of the SEEA EEA that has been
recently launched with the objective of adopting
international agreed concepts, classifications
and methodologies for ecosystem accounting. The
involvement of the EO community in this work is
not only welcome but needed.
System of Environmental-Economic Accounting
Experimental Ecosystem Accounting (SEEA
EEA).
The main goal of SEEA is to establish the link
between the environment and the economy in a
consistent, comparable and coherent manner. The
SEEA EEA starts from the perspective of ecosystems
and links ecosystems to economic and other human
activity. In particular, it brings the spatial
dimension into environmental accounting and the
need to link statistical accounts to geospatial
information and Earth observation.
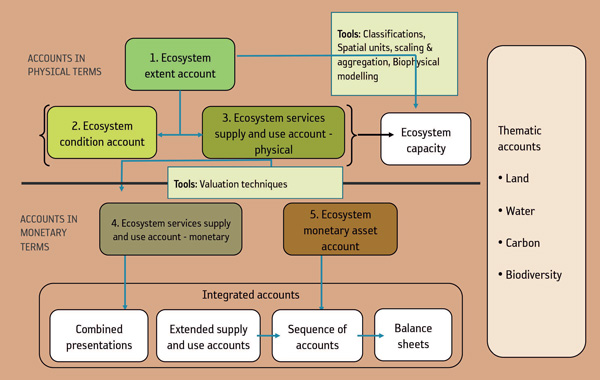
The SEEA EEA is underpinned by a set
of accounts and tools, as shown below. The main
accounts of extent, condition, and ecosystem
services are complemented by thematic accounts of
land, water, carbon and biodiversity, altogether
supported by tools, such as classifications,
spatial units, scaling and biophysical modelling.
Brazil example: Brazilian Institute of
Geography and Statistics (IBGE). Land-cover and
land-use changes in Brazil, 2000-2010-2012. Rio de
Janeiro, 2015. Prepared in cooperation with Wadih
Neto and Fernando Dias from IBGE.
Nepal example: Uddin, K., et al.,
2014. Development of 2010 national land cover
database for the Nepal, Journal of Environmental
Management, Volume 148, 15 January 2015, Pages
82-90.
http://dx.doi.org/10.1016/j.jenvman.2014.07.047
Prepared by Michael Bordt, ESCAP.
D. H. Hoekman, M. A. M. Vissers and N.
Wielaard, “PALSAR Wide-Area Mapping of Borneo:
Methodology and Map Validation,” in IEEE Journal
of Selected Topics in Applied Earth Observations
and Remote Sensing, vol. 3, no. 4, pp. 605-617,
Dec. 2010.
http://library.wur.nl/WebQuery/wurpubs/407385