In Season Yield Forecasting for Decision Making in Malawi
Agriculture
Decision-Making Context and Needs | Earth Observation Application/Service Description | Earth Observation Data Products and Information Underlying Observations and Data Sources | Impacts and Benefits | Further information and guidance
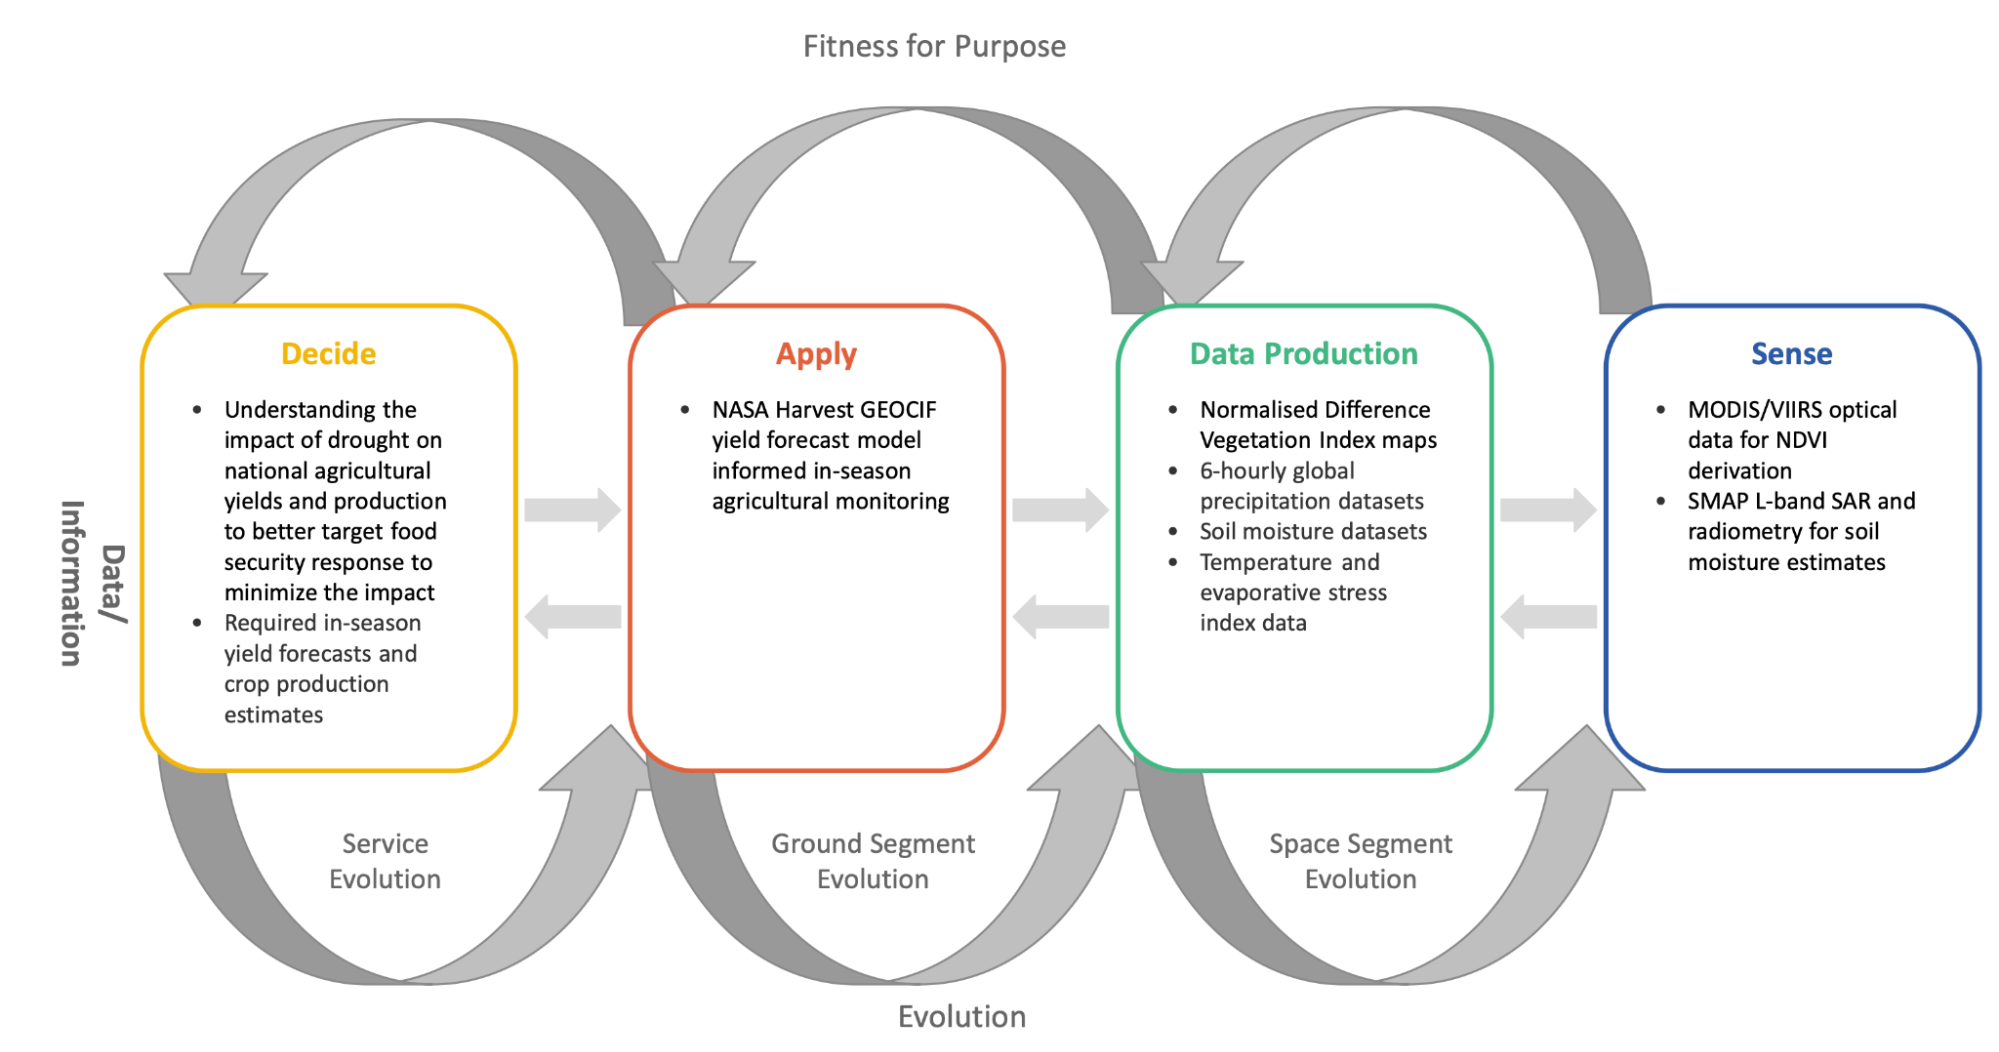
Figure 1: The value chain for the Malawi project
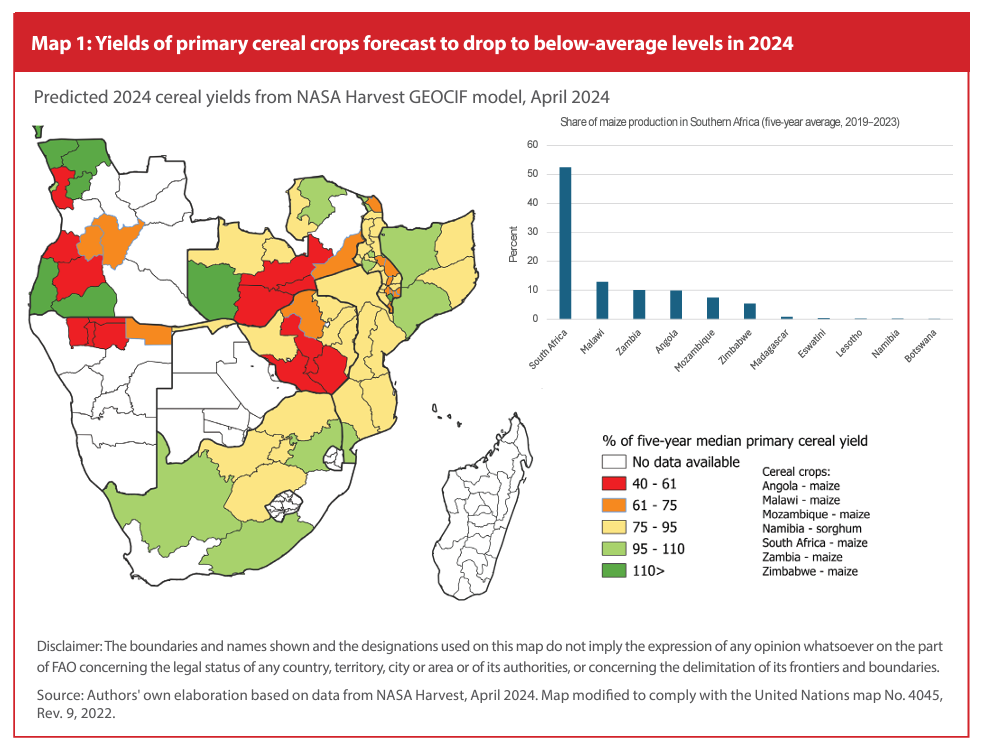
The 2023/2024 El Nino event had a devastating impact on more than 27 million people in Southern Africa and caused the region's worst hunger crisis in decades. Six countries declared a state of emergency due to the El Niño-induced severe drought. Botswana, Lesotho, Namibia, Malawi, Zambia and Zimbabwe. In Malawi, prolonged dry spells and high temperatures damaged nearly 1 million hectares of crops resulting in a 23% reduction in crop yields and a state of emergency to be declared in 23 of 28 districts. These conditions directly impact local farmers across Southern Africa, with consequences for regional food supply, meaning local policy makers need informed, coordinated and effective strategies for handling drought conditions. This decision-making process requires timely and accurate crop health, and environmental conditions information.
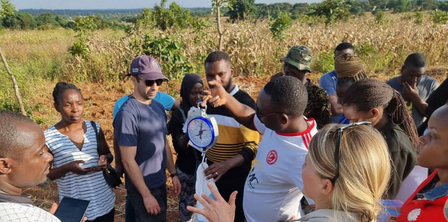
Figure 2: Training crop cut technicians on sample techniques for the 2023 Crop Cut Campaign in Kasungu District Malawi
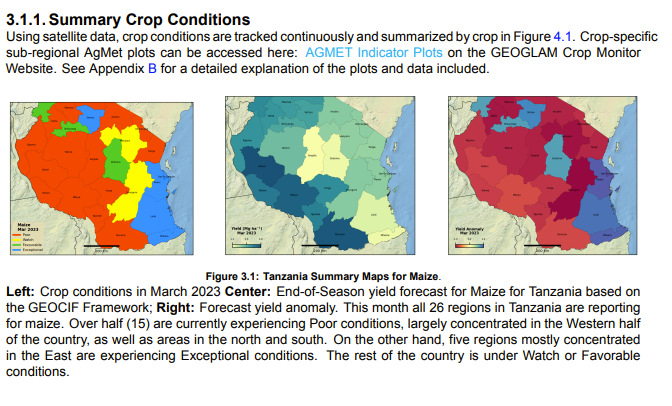
Under GEOGLAM (Group on Earth Observations Global Agricultural Monitoring), NASA Harvest partnered with the United Nations Food and Agriculture Organization (FAO) to provide GEOCIF in season yield forecast estimates to the Ministry of Agriculture in Malawi during the 2024 El Nino event to inform the government's drought response. GEOCIF is the Global Earth Observations for Crop Inventory Forecasting model - a machine-learning based approach that uses Earth Observation (EO) datasets and applies the Climatic-Impact Driver (CID) framework to produce a suite of indicators that quantify both average climate conditions (e.g., seasonal temperature, precipitation) and extreme events (heat waves, cold snaps, droughts, and compound hazards). These indicators feed into ensemble models that learn crop-specific, regionally tuned relationships between climate, vegetation health metrics, and historical yield outcomes. The resulting system delivers probabilistic, county/state-level yield forecasts two to three months before harvest, and explainable‐AI diagnostics highlighting the dominant CIDs driving forecast uncertainty, and empowering governments and partner institutions with timely, actionable insights to support farmers. GEOCIF has been used operationally in multiple yield forecasting exercises for the FAO, Alliance for Green Revolution in Africa (AGRA), and the United Nations Office on Drugs and Crime (UNODC).
|
|
|
|
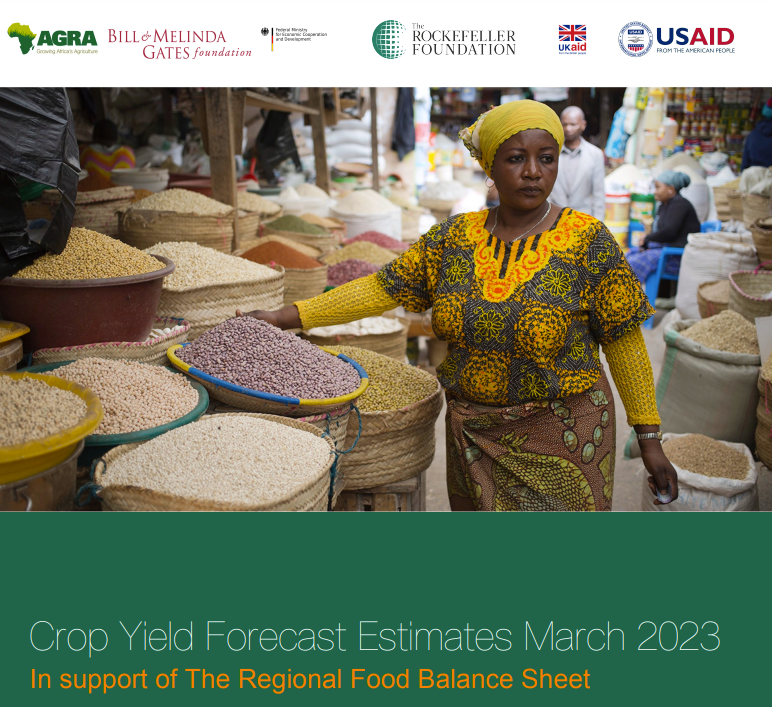
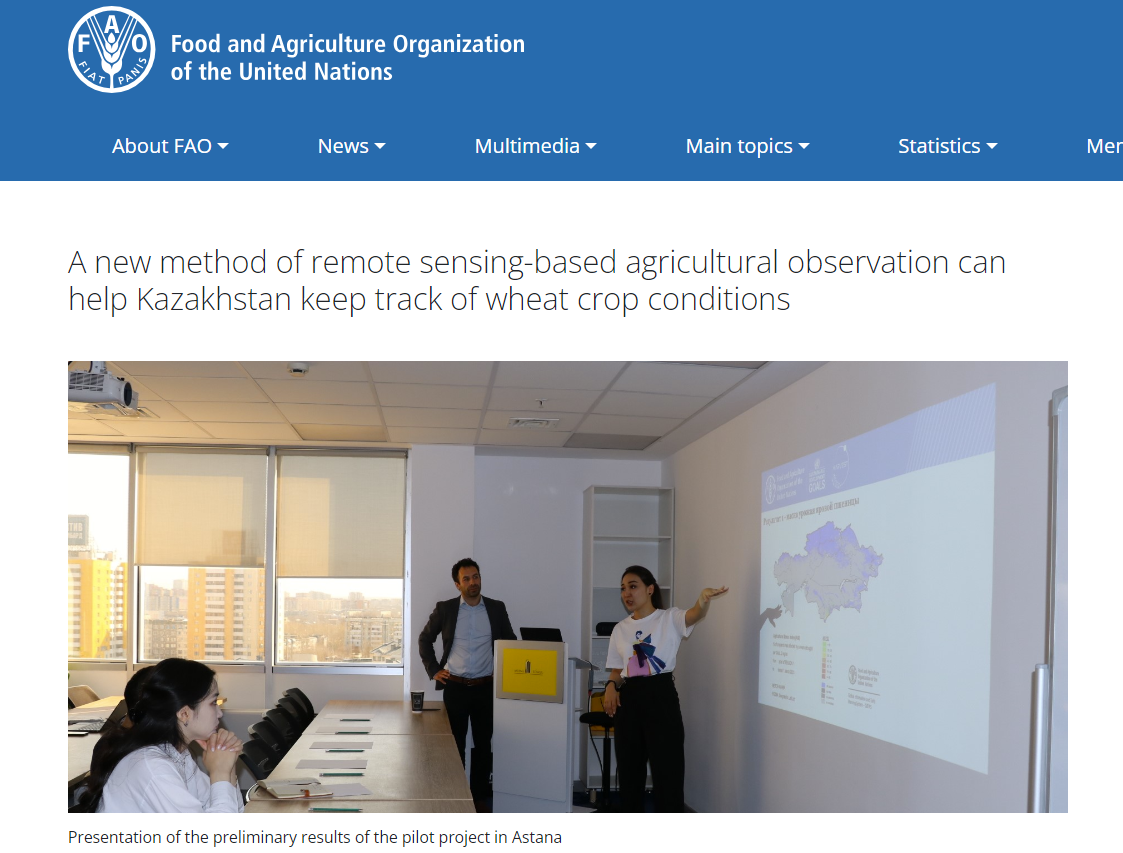
Figure 3: Public examples of GEOCIF usage. Clockwise from top left: Alliance for Green Revolution in Africa (AGRA) maize and bean yield forecasts for Eastern Africa in 2021 and 2022; Kazakhstan wheat forecast for FAO in 2022 and 2023; Tanzania maize forecast for AGRA in 2021 and 2022, and Southern Africa yield forecast for FAO in 2023
The IPCC Sixth Assessment Report defines a CID as a climatic condition or category, like extreme heat, that impacts natural and human systems, such as agricultural yields. The CID framework builds on the development of climate indices by the World Climate Research Program (WCRP) by encouraging the inclusion of non-traditional climatic information. It does so by looking beyond drought and precipitation related indices for agriculture and developing a process to identify more precise CID indices and thresholds that can be linked to distinct system responses e.g. canopy temperature above a threshold impacts plant growth through changes in crop photosynthesis.
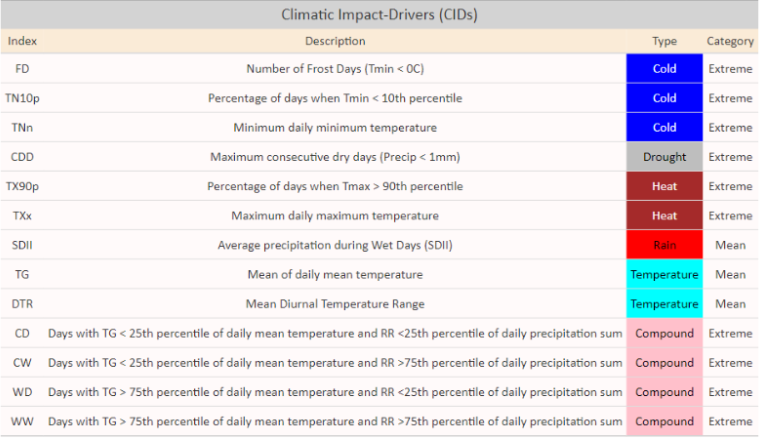
Figure 4: Representative CIDs representing two types: Mean, Extreme; and seven categories: Drought, Heat, Temperature, Rain, Compound, Snow and Cold
The NASA Harvest GEOCIF yield forecast model provides early, reliable estimates of in-season crop yields at the district level in Malawi to support strategic planning and risk management. The GEOCIF model uses satellite and environmental data to track growing-season conditions and identify climate risks, such as droughts or heat stress that can affect agricultural production. By combining these data with historical crop production information, GEOCIF produces yield forecasts at an administrative level, along with clear indicators of confidence and risk. This allows decision-makers to better anticipate potential production shortfalls, understand the main drivers of uncertainty, and take proactive steps to support food security and agricultural resilience.
Climatic-Impact Drivers are derived from a range of data products based on Earth observations, including: time series of MODIS / VIIRS NDVI; Climate Hazards Center Infrared Precipitation with Stations (CHIRPS) precipitation data; FLDAS and SMAP soil moisture; and temperature and evaporative stress index data from NOAA Climate Prediction Center. A range of these products is shown below in Figure 5 from NASA Harvest Agrometerological Indicator Graphics.
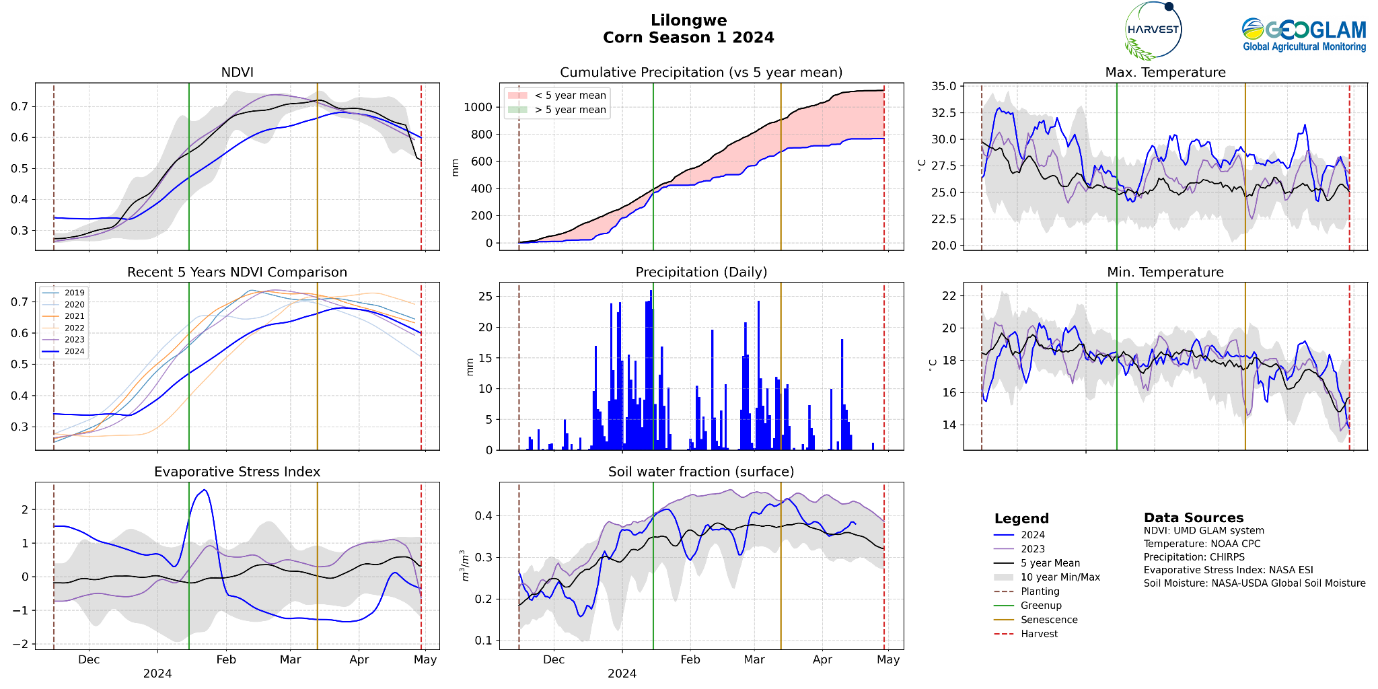
Figure 5: NASA Harvest Agrometerological Indicator Graphics
The AGMET tool combines multiple key EO variables for agricultural monitoring into coherent contextualized visualizations that clearly show how current season conditions compare with recent averages and extremes, enabling users to detect anomalies early in the season and adjust monitoring priorities or response plans accordingly. The system delivers regular updates (every 7–12 days) of EO time series for key variables — NDVI, precipitation, soil moisture, evaporative stress, and temperature — and contextualizes them against 5- and 10-year historical ranges to reveal deviations from normal patterns. By integrating multiple environmental and vegetative variables into standardized, crop-specific indicators and updating them frequently, the tool provides timely, digestible insight into in-season crop health that supports proactive decision making rather than retrospective analysis.
These satellite based inputs along with subnational crop production data are used in GEOCIF to learn crop-specific, regionally calibrated relationships between climate conditions, vegetation health, and historical yield outcomes. With these inputs, the model produces probabilistic yield estimates at the subnational scale, along with diagnostics that identify the dominant CIDs contributing to forecast uncertainty and model drivers.
The primary data sources for GEOCIF are the CHIRPS rainfall dataset, which uses a variety of space and ground based sensing platforms; NASA’s Terra and Aqua atmosphere, land and ocean environmental satellites; and the SMAP global soil moisture mission.
During the 2024 cropping season, in partnership with FAO the NASA Harvest GEOCIF yield forecast model was adapted for use at the request of the Malawi Ministry of Agriculture and provided on a monthly basis to inform in-season agricultural monitoring & crop production estimates. In-season yield forecasts are important as they provide additional evidence of potential crop production shortfalls often earlier than traditional crop assessments and of a larger-geographic scale. This timely data can be used to reduce uncertainty and support proactive decisions while there is still an opportunity to respond early to potential shortages and reduce impacts to the most vulnerable populations.
GEOCIF provided the Ministry with reliable and more frequent updates on the yield forecasts and early warning signals on national food security that enabled policy makers in the public, private and non-state sectors to make early, informed decisions to address the impending food situation. The results were used to validate the crop estimates from the traditional crop production survey from the Ministry of Agriculture, and the National Committee on Crop Estimates recommended the incorporation of the model into the crop estimates survey as an early warning and crop monitor tool for the Ministry.
Points of contact:
Agmet Indicator Tool: https://cropmonitortools.org/tools/agmet/
HarvestStat Subnational Crop Production Data: https://www.harveststat.org/
Other resources:
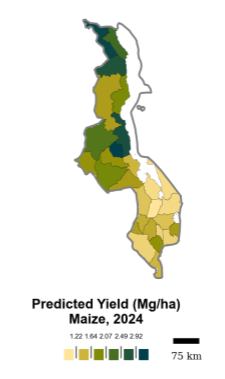
Figure 6: GEOCIF yield forecast estimates from 2024