The ‘Urban’ SDG and the Role for Satellite Earth Observations
UN-Habitat is leading the coordination of several methodological developments for monitoring of urban-related SDG indicators as a Custodian Agency and is supporting the cross-sectoral coordination of the human settlements indicators to allow for synergies and consistency in the monitoring and reporting amongst institutions on all urban-related indicators. This role also involves developing new ways of data collection and guiding partners on use of new technologies in monitoring locally and globally the urban-related SDGs. This article highlights some of our experience using Earth observation (EO) data and the associated challenges and opportunities for measuring and monitoring the performance of cities through such data.
6.1 Sustainable cities
SDG 11, “Make cities and human settlements inclusive, safe, resilient, and sustainable”, stands out as a goal that has placed explicit focus on the measurement of indicators at a sub-national level (cities or human settlements), with several indicators requiring geospatial data for monitoring. This geospatial data dependency offers a unique opportunity to integrate geospatial information into the national and global statistical data infrastructure demands in a more holistic and policy-driven manner. But it is also symptomatic of the need for capacity development at multiple levels across the entire national statistical systems that will support SDG data collection.
The focus on cities and urbanisation underscores their roles as predominant sites of economic, social, environmental and health issues at the centre of global development policy discussions today. Whilst the linkages between cities and urbanisation to development outcomes may be clear conceptually, measuring SDG indicators at the level of cities and human settlements raises a number of challenges, such as:
− definition - of what constitutes cities and settlements;
− scope – and which cities or urban areas to include for monitoring;
− what capacities exist at national statistical levels to support new ways of data collection;
− the potential for EO data - to inform SDG monitoring efforts; and
− its integration with existing datasets for spatially explicit definitions of cities in a globally consistent manner.
Significant work has been invested in establishing an understanding of the distribution and size of human settlements that can help with the issues of definition. As with all of the SDGs, it is imperative to have consistent definitions applied across national reporting mechanisms if meaningful and consistent comparisons and global statistics are to be derived. National Statistical Offices (NSOs) employ differing criteria to classify settlements along the urban-rural divide, such as population or population density thresholds, and the threshold values may vary greatly across countries. Since an urban settlement in one country may be rural according to another country’s standard, national definitions cannot be used to derive and apply a consistent global assessment of urban versus rural. The recent availability of global built-up area datasets (see the further information links at the end of the article) makes it possible to pursue spatially explicit and globally consistent approaches to defining settlements that provide a more accurate assessment of the number of settlements, their boundaries and their associated areas.
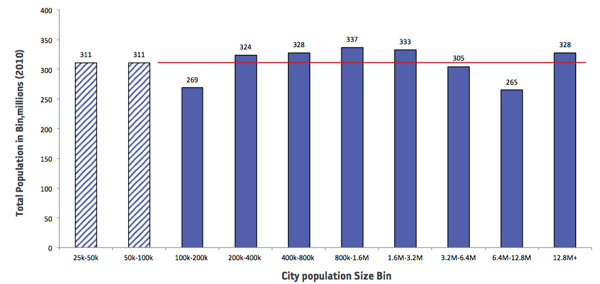
Work on the Atlas of Urban Expansion that was led by UN-Habitat and New York University provides an estimate of the total population living in ‘large’ cities with populations of at least 100,000 (in 2010). This work identified 4,231 self-standing cities and metropolitan areas, representing a total population of approx. 2.5 billion people. The names, locations and populations of these cities were identified after a year and a half of research, comparison and consultation with multiple data sources and organisations, including www.citypopulation.de, the UN Population Division, the Chinese Academy of Sciences and the European Commission.
The contribution to global population of these cities of different sizes is illustrated in Figure 1. This shows, for example, that cities with a population of more than 12.8 million people were home to a total of around 328 million people in 2010. It also illustrates that definition and scope of monitoring urban environments will have a significant impact on how much of the global population and their settlements is covered by the SDG indicator framework – with over 300 million more people (and another 4000+ cities) included should the scope extend to cities as small as 50,000 in population.
Figure 1: The 4,231 cities in the 2010 universe of cities arranged in population bins
6.2 Our use of EO data
Urban extent and boundaries are an obviously important part of getting scope and definitions consistent and EO data can certainly help here. However, translating EO datasets into settlement boundaries requires analytical approaches that group remotely-sensed built-up areas and open space pixels in ways that match our preconceived notions of how cities and metropolitan areas manifest spatially. Not all cities meet the simplistic notion of a compact cluster of built-up area completely surrounded by wide open countryside. Individual clusters may be completely surrounded by open space but they are not necessarily individual settlements; non-contiguous built-up areas and the open spaces surrounding them and captured by them may represent a singular connected area, such as an integrated labour market we associate with a metropolitan area.
One criterion that we know is available globally, and that we have applied in our analysis, exploits the spatial relationships of built-up and open pixels contained within the remotely-sensed datasets. We analyse raster datasets and employ a variation of a gravity model whereby non-contiguous clusters of built-up area are joined together if their sizes and the distance between them meet some threshold, suggesting that the clusters ‘interact’ across space as part of an integral unit. The spatial clustering rules we employed are visually intuitive and easy to apply with existing data sources.
The above rules were applied globally to 200 study areas to delineate settlement boundaries or urban extent boundaries across three time periods, 1990, 2000 and 2015. The results were positive in that they delineated settlement boundaries both for large metropolitan areas and small cities of 100,000 with high accuracy, to the extent that the boundaries matched expert opinion of what acceptable settlement boundaries would be. Certain settlement types, such as very large conurbated regions or areas separated by large bodies of water required manual editing; additional work is needed to refine the automated procedure for these cases.
Rules incorporating commuting or mobility data, which indicate actual spatial interaction and the level of connectedness between non-contiguous areas, or rules that use population or employment densities measured over small areas, representing the level of human activity across space, can be applied to devise more sophisticated and externally objective grouping rules. These criteria are in fact applied by statistical agencies where this data is available, but today this is typically only in a small number of OECD countries.
At the global level, ‘urban’-related SDGs require an operational human settlement or city definition that brings these objects of study into focus. The definition should be intuitive and measurable and it must be applicable globally with existing or easily obtainable data sources. More importantly, the definition should ensure that it is easy to count and account for all the spaces and settlements in the statistics in line with the SDG’s principle of “leaving no one behind”.
EO data provides researchers an increasingly better understanding of the location, number and size of human settlements on the planet, since they are typically associated with impervious surfaces used for roads or building materials. The technological capability to identify these surfaces from space has existed at least since the early 1970s and with improved spatial resolution and revisit frequency from multiple satellite series today. But EO data used in this way will always need to be supplemented with in-situ observations and interpretation since not all built-up areas represent human settlements and not every human settlement may be of interest for monitoring urban indicators associated with SDGs.
Many of the Goal 11 targets address social, economic, environmental and health concerns that require some level of in-situ data collection within settlement boundaries. The data collection strategy must be comprehensive in the sense that the outcome should be an accurate measure over the settlement area of its population. A few Goal 11 targets may be observable from space or largely observable from space, such as those related to air quality, transport and urban sprawl, but measuring Goal 11 indicators will almost certainly require on-the-ground data collection efforts, either by the municipal authorities within the settlement boundary or by outside parties. Given the extremely low likelihood that this data can be collected for all settlements (however the universe of settlements is defined), a sampling approach seems more feasible, the results of which can be generalised to understand the distribution of values for the regions and countries of interest. UN-Habitat has developed a guide for member states to apply this model, commonly referred to as the “national sample of cities (NSC)” approach.
6.3 Going forward on SDG 11
Enablers such as the internet, cloud computing, Big Data, mobile devices, unmanned aerial systems, social media and the explosion of location-based services have ensured that people all over the globe are beginning to study and characterise their settlements more thoroughly and frequently.
EO data is no doubt going to play a significant and central role in the global reporting processes for the next 15 years. Its use will not be in isolation and must be guided by issues around definition and scope and supported by complementary in-situ information. Concrete guidance on definitions, measurements and unified standards is necessary to make sure that we work with harmonized and mutually agreed concepts.
For Goal 11, the following indicators will have a heavy dependence on EO data for their feasibility:
11.1.1 Proportion of urban population living in slums, informal settlements or inadequate housing.
11.2.1 Proportion of population that has convenient access to public transport, by sex, age and persons with disabilities.
11.3.1 Ratio of land consumption rate to population growth rate.
11.6.2 Annual mean levels of fine particulate matter (e.g. PM2.5 and PM10) in cities.
11.7.1 Average share of the built-up area of cities that is open space for public use for all, by sex, age and persons with disabilities.
6.4 Examining progress on SDG 11.3.1
Efforts on monitoring SDG indicator 11.3.1 on ‘land consumption rates’ (from our global sample of cities work) have demonstrated that the opportunities and challenges for global monitoring come in equal measure. At the global level, more EO data is now available today with higher revisit frequency and at higher resolution to facilitate the monitoring of several urban SDG indicators including 11.3.1. But data itself is not sufficient and capacity building of national data systems, as well as removal of data complexity, must be addressed.
So too must the need for standard methodologies and definitions to allow consistent and comparable national reporting. UN-Habitat proposes the use of ‘urban extent’ for the delimitation and measurement of cities and urban agglomerations in monitoring and reporting on indicator 11.3.1. The adoption of this concept will enable national governments and development partners to standardise the definition and the unit of measurement for global urban reporting. This standard definition will not necessarily usurp local definitions but it will prevent inconsistencies arising from the use of different urban definitions when collecting and analysing information at city and sub-city levels.
Figure 2: UN-Habitat - a guide for member states on the application of the concept of National Sample of Cities is now available: http://unhabitat.org/national-sample-of-cities
The application of EO data at local or sub-national levels will no doubt create steep learning curves for even the most data advanced countries. At the national level, we anticipate several challenges given the variations in levels of understanding and ability to apply or deploy the use of EO data in many national statistical organisations. At the local level, skill shortages will be an issue. North-South and South-South cooperation around capacity development will be needed and should be coordinated through existing regional bodies and networks as an initial starting point.
Article Contributors
Robert P Ndugwa (Global-Urban Observatory Unit, Research and Capacity Development Branch, UN-Habitat)
Global Urban Observatory, UN-Habitat 2016. National Sample of Cities: A model approach to monitoring and reporting performance of cities at national levels: unhabitat.org/national-sample-of-cities