The cryosphere – composed of Earth’s ice, snow and frozen ground – is a critical component of the global system that is undergoing rapid change with direct impacts to society. Consequently, the Global Climate Observing System Implementation Plan defines several Essential Climate Variables focused on or related to the cryosphere, as follows:
− Sea level: globally, sea level is rising due to the combined effects of the thermal expansion of warming ocean water and loss of ice from Greenland and Antarctica, as well as from other smaller ice caps and glaciers throughout the world. Studying the contribution from land ice is critical because these systems demonstrate the potential for dynamic, rapid change that could contribute enough water to the ocean to reshape coastlines and displace millions of people.
− Ice sheets: combined, the Greenland and Antarctic ice sheets contain approximately 33 million km3 of ice, enough to raise sea level by nearly 64 m. In general, snow and ice accumulate in the interior of the continental ice sheets, and mass is lost to the ocean through surface melting, subsurface melting and iceberg calving. The processes are dynamic and complex. Surface melting has been continuously moving to higher elevations in Greenland. The ice itself flows from the interior towards the coast at rates of up to 20 m per day, and may extend out into the ocean, forming floating ice shelves, particularly in Antarctica. These shelves are subject to melting from beneath by warm ocean waters, and their breakup has triggered surging of their feeder glaciers.
− Glaciers and ice caps: outside the major ice sheets, glaciers and ice caps represent the vast majority of the remaining ice on Earth. These smaller ice masses have a relatively short response time to climate perturbations, making them early-warning indicators of global climate change. Furthermore, although they represent only 0.4% of Earth’s ice by area, glaciers and ice caps have made the largest recent (1993-2003) contribution to global sea-level rise, after thermal expansion. Finally, ice loss from such glaciers and ice caps has serious impacts on the terrestrial water cycle and on societies dependent on glacial melt water.
− Albedo: a certain percentage of the solar radiation reaching Earth’s atmosphere and surface is reflected back to space. This percentage depends on the albedo, or reflectivity, of the surface. Ice and snow have a very high albedo, reflecting about 80% of incident sunlight. As snow or ice cover decreases, however, less of this incident radiation is reflected – as albedo is reduced – and more is absorbed by the atmosphere and the surface.
− Sea ice: decreases in the extent and thickness of the Arctic sea ice, particularly of the perennial ice, have a significant impact on the exchange of energy between the atmosphere and the ocean. Open water areas exposed by melted sea ice are subject to wind-driven circulation and absorb more incident solar energy, increasing ocean temperatures, which increases melting. At the same time, thin ice – or its absence entirely – allows more heat to escape from the ocean to the colder atmosphere, raising surface air temperatures and potentially driving thawing of frozen ground on surrounding lands. Furthermore, as sea ice melts, fresh water is introduced to the surrounding ocean, decreasing the salinity and density, and increasing the buoyancy of the surface water. All of these processes can disturb the thermohaline ocean circulation pattern and thereby alter global weather patterns.
− Snow cover: as with sea ice, snow cover plays an important role in controlling the albedo of Earth’s surface, with the seasonal component dominating the annual and interannual variations. On a local scale, snow cover is critical to regional hydrology. Alterations in the mass of snow and timing of melting greatly affect water resources for consumption, irrigation and even power generation.
− Permafrost: ground that remains frozen throughout the year is defined as permafrost. Like snow cover, permafrost occurs principally in the northern hemisphere, although it exists in mountainous regions throughout the world. Its depth and extent are sensitive indicators of temperature change, but, more importantly, permafrost thawing may lead to the release of large volumes of greenhouse gases. Thawing permafrost also alters ecosystems and causes the collapse of infrastructure.
Role of Satellites
The cryosphere is found in the most inaccessible areas of Earth: the Arctic, the Antarctic and the high mountains of the temperate zones. For four decades, satellites have been indispensible tools in monitoring them. Sea ice is primarily observed by passive microwave instruments that provide wide-area, all-weather, day-and-night observations that enable nearly complete and routine monitoring. They have revealed a dramatic decline in the average annual sea ice extent of 4.4% per decade over the last 32 years. More recently, other satellite instruments have augmented these passive microwave records, including: synthetic aperture radars (such as ERS-1/2, RADARSAT-1/2, Envisat ASAR, and ALOS PALSAR), scatterometers (such as ERS Windscat, QuikScat and ASCAT) and spectroradiometers (such as MERIS, MODIS and AVNIR). Together with buoy data, these satellite observations are used to monitor ice drift, to understand seasonal to interannual variations in sea-ice growth and melt processes, and to support operational sea-ice services.
For the Greenland and Antarctic ice sheets, satellite-based altimeters and SARs are providing key insights into ice topography and the velocities at which ice flows to the sea. In particular, ESA’s ERS-1, ERS-2 and Envisat satellites compiled a long-term radar altimetry record, beginning in 1991 and extending to 2011. NASA’s ICESat satellite, which operated from 2003 to 2009, extended coverage of the ice sheets, using a laser altimeter to map the surface with much higher resolution. ESA has operated the CryoSat-2 satellite since April 2010, with its SAR/Interferometric Radar Altimeter (SIRAL), which operates in three modes, to provide detailed geodetic elevations across ice sheets and sea ice. Data collected by CryoSat-2 has already been used to produce preliminary maps of Arctic sea-ice thickness, Arctic Ocean circulation and a topographical relief map of Antarctica.
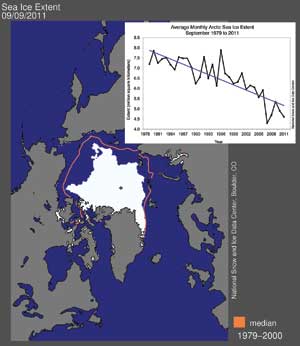
Figure 1. Extent of Arctic sea ice coverage at its seasonal minimum
in September 2011, which nearly equalled the record low set in 2007.
This minimum is 2.38 million square kilometers below the average
minimum extent observed between 1979 and 2000 (courtesy
NSIDC).
(Click image to view full size)
In addition to their radar altimeters, SARs aboard the ERS and Envisat satellites have provided unprecedented detail about the flow of ice, highlighting its importance for regional mass balance, as well as the critical roles played by ice streams and ice shelves in the overall stability of large ice sheets.
Further SAR-derived contributions have also been made by the Japanese ALOS satellite, launched in 2006 and operated until 2011; the RADARSAT-1 and -2 satellites, launched by Canada in 1995 and 2007, and -2 is still operating; the TanDEM-X and TerraSAR-X satellites, launched by Germany in 2007 and 2010 and still operating; and the Cosmo-Skymed four-satellite constellation launched between 2007 and 2010 and currently in operation. Recently, scientists compiled SAR data from these satellites to construct the first comprehensive pole-to-coast map of ice velocity in Antarctica.
Together, satellite altimeters and SARs have characterised seasonal to inter-annual changes in the ice sheets over moderately sloping regions from basin to continental scales. These data indicate that, although the central parts of the ice sheets appear stable, dramatic changes are taking place along their margins, throughout Greenland and particularly around the West Antarctic ice sheet. Further insight is also being provided by the gravity surveys of the Gravity Recovery and Climate Experiment (GRACE) satellite mission, which provides independent estimates of ice mass. The accuracy of overall ice sheet mass balance has been improving significantly with additional observations. The dramatic disintegration of ice shelves, such as Larsen-B in Antarctica, indicate that ice sheet and ice shelf dynamics may be considerably more sensitive to short-term climate fluctuations than formerly believed.
Airborne surveys such as NASA’s Operation IceBridge and ESA’s CryoVEx campaigns have also provided more detailed altimetry surveys while collecting a variety of complementary measurements, including ice thickness and bedrock topography beneath floating ice shelves to better characterise ice flow dynamics, which are essential to improving predictive models of ice sheet behaviour.
As with other components of the cryosphere, changes in snow cover significantly influence both the energy and freshwater balances for Earth. Long-term passive microwave records, supplemented with spectrophotometer, scatterometer and SAR data, indicate that snow covers up to 30% of the land surface seasonally. As global warming continues, predictions suggest that regions currently experiencing snowfall will increasingly receive precipitation in the form of rain, and for every 1oC increase in temperature, the snowline will rise by 150 m in altitude. This has important implications for water storage, particularly in communities that rely on the melting of snow in the spring.
Finally, permafrost or perennially frozen ground is estimated to underlie 24% of the exposed land area in the northern hemisphere. Fluxes of gases from northern ecosystems represent a highly uncertain contributor to future global climate change, and in situ observations suggest that further warming will strongly modify these fluxes. The wet lowlands of the Arctic permafrost landscapes, for example, are poorly constrained natural sources of greenhouse gases. Furthermore, satellite observations have detected accelerated melting of Siberian bogs, which may release significant amounts of methane into the atmosphere. Melting of permafrost, and the collapsing of soil that follows, can also lead to significant damage to infrastructure, such as roads, houses and pipelines. Scatterometers and SARs have been used to observe the characteristics of permafrost areas, but more systematic observations at higher spatial resolution are needed.
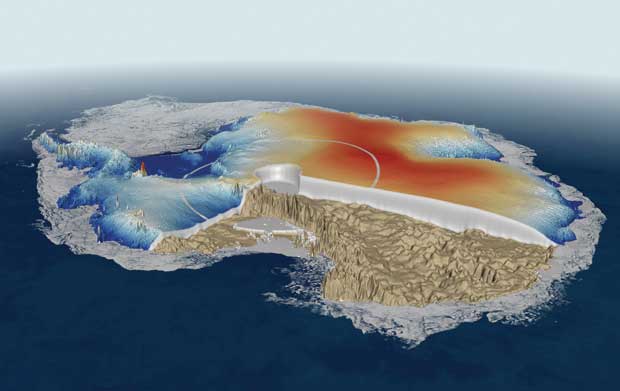
Figure 2. CryoSat-derived topography of the Antarctic ice sheet
plotted onto the Antarctic bedrock (courtesy BEDMAP).
The plot indicates the limit of orbital coverage at 88oS
and advantages in coverage in relation to the circle at 82o,
which describes the former southern limit of ERS and Envisat radar altimetry
coverage (courtesy UCL/Planetary Visions).
CryoSat-2
The European Space Agency’s CryoSat-2 ice satellite was launched in April 2010 and is now realising its potential en route towards achieving the objectives of the original planned three-year mission. A significant setback had occurred in 2005 with a launcher malfunction and loss of the original satellite. The rapid decision to approve a replacement signalled the scientific priority and urgency attached to the mission’s goals to survey natural and human-driven changes in Earth’s cryosphere.
The primary SIRAL instrument on CryoSat employs new technology by comparison to the previous generation of radar altimeters, and is designed to provide more precise all-weather, year-round elevation measurements of the surface of marine ice and the large Greenland and Antarctic ice sheets. Characterised by a near-polar orbit, which provides dense polar coverage up to a latitude of 88°, the mission is designed for the purpose of measuring the seasonal and inter-annual changes in ice surface elevation. Its precise measurements of the rate of change in the elevation of the ice over time are now providing direct evidence of the changes that the polar regions are experiencing in relation to global climate change.
The ice sheets that blanket Antarctica and Greenland are several kilometres thick and the growth and shrinkage of these ice masses have a direct influence on global sea level. Figure 2 shows an example of a compilation of CryoSat elevation measurements in the form of an Antarctic topographic map, and a cross-section through the ice to the bedrock beneath. The elevation dataset in conjunction with the bedrock beneath provides an essential combination of data that are required to develop realistic models of ice sheet behaviour.
By comparison to the several kilometre-thick Antarctic ice sheet, floating marine ice or sea ice is only up to a few metres-thick. In spite of this, sea ice has a significant regulating influence on regional and global temperatures by reflecting radiation back into space, as well as insulating the polar oceans and redistributing freshwater in the form of ice. By contrast to the kilometre-thick ice sheets, measurement of sea-ice surface elevation presents a unique set of challenges. To cope with this, CryoSat is equipped with a radar that provides high along-track resolution, in order to resolve and provide accurate ranging to the narrow cracks or leads within the extensive Arctic sea-ice cover. This provides the ability to measure the elevation of the surface of sea-ice floes in relation to the sea surface accurately, a quantity known as freeboard. With the density of the ice, the freeboard is converted into sea-ice thickness. With its dense orbital coverage, CryoSat allows monthly statistics of the elevation and thickness to be derived, and thus the seasonal to inter-annual variations in thickness can be detected.
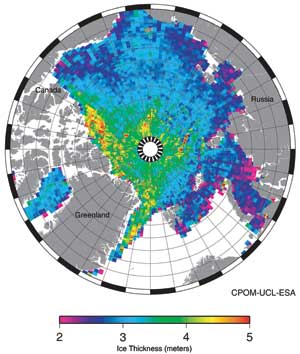
Figure 3 shows CryoSat results indicating the Arctic winter sea-ice thickness distribution in
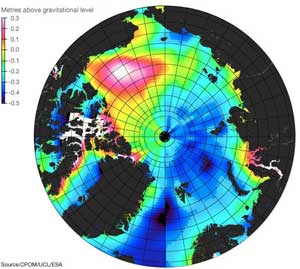
January–February 2011. An important new feature of the CryoSat mission is the need to obtain measurements of the surface of the polar ocean. Former altimeter missions were not optimised to obtain robust measurements of sea-surface topography in the presence of sea ice. Figure 4 indicates the absolute Dynamic Topography, which is the height variation of the ocean surface relative to a gravitational geoid (such as the latest GOCE geoid). Monthly plots such as this can be used in future to provide significant new insight into high-latitude ocean circulation and freshwater storage in the large gyre circulation beneath the Arctic sea ice.
Figure 3. CryoSat-derived sea ice thickness in the Arctic Ocean in January–February 2011 (courtesy CPOM/UCL/ESA).
International Cooperation
The Integrated Global Observing Strategy Cryosphere Theme created a framework for improved international coordination of measurements to foster a more comprehensive and integrated cryosphere observing system. It is a combined initiative of the World Climate Research Program, Climate and Cryosphere (CliC) Project, and the Scientific Committee on Antarctic Research (SCAR). This framework facilitates the flow of data and information in cryospheric research, long-term scientific monitoring, and operational applications. The Cryosphere Theme Report was presented to and approved by the IGOS Partners in May 2007 and is now in the implementation phase. Many of its recommendations for improving the cryosphere-observing system will be implemented by the World Meteorological Organization’s new Global Cryosphere Watch (GCW), which will facilitate the use of satellite data and products in studies of the changing cryosphere.
Among the major efforts recommended by the Theme was the International Polar Year 2007-08, which actually extended from March 2007 to March 2009. Organised by the International Council for Science and WMO, this was actually the fourth IPY, following those in 1882-83, 1932-33, and 1957-58. It involved over 200 projects, with thousands of scientists from over 60 nations examining a wide range of physical, biological and social research topics.
One of the flagship IPY projects was the Global Interagency Polar Snapshot Year, which was implemented by the IPY Space Task Group. This group coordinated international space agency planning, processing and archiving of the IPY Earth Observation legacy dataset, including: the first high-resolution, comprehensive map of ice velocity in Antarctica, derived from various interferometric SAR satellites; high-resolution digital elevation models of the perimeters of the ice sheets and ice caps, synthesised from stereo pair imagery collected by France’s SPOT satellite; a 25-year record of wind, cloud and surface properties, and radiation, using historical AVHRR measurements; and studies of polar atmosphere dynamics and chemistry performed with NOAA and EUMETSAT operational data.
Figure 4. CryoSat-derived absolute Dynamic Topography in the
Arctic Ocean and north Atlantic, with the red region indicating high
elevations in the Beaufort gyre region (courtesy CPOM/UCL/ESA).
Mapping Antarctica
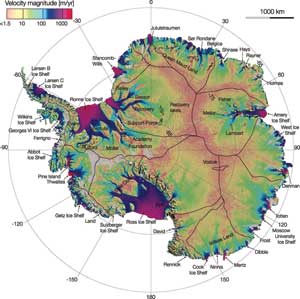
Scientists have assembled a comprehensive, high-resolution, digital mosaic of ice motion in Antarctica, using 900 satellite tracks and more than 3000 orbits of radar data collected during the International Polar Year 2007 to 2009. Published in a September 2011 issue of Science, this study, by Rignot et al., and entitled, ‘Ice Flow of the Antarctic Ice Sheet’ was enabled by an extraordinary collaboration between the space agencies of the United States, Europe, Canada and Japan.
Until now, there has been no clear picture of ice-sheet motion at the continental scale. The vast extent of East Antarctica, representing ~77% of the continent, has been devoid of quality data. Only a few floating ice shelves have been mapped, and comprehensive velocity mapping has been limited to the lower reaches of key outlet glaciers. This lack of broad-scale detailed observations of ice motion has placed a fundamental limit on the capability of numerical models of ice-sheet evolution. This recent, comprehensive survey of Antarctica was obtained by combining data from a variety of orbiting interferometric synthetic aperture radar (InSAR) instruments, including RADARSAT-2 (Canada), Envisat ASAR (Europe), ALOS PALSAR (Japan) and ERS 1/2 (Europe). Each instrument contributed unique coverage and performance.
The resulting mosaic, shown in Figure 1, confirms some well-known behaviour, but also reveals a wealth of new information. The ice velocity ranges from a few cm/year near ice divides to a few km/year on fast-moving glaciers and floating ice shelves. The distribution of velocities has one peak at 4-5 m/year, for the slow-moving ice in East Antarctica, and another peak at 250 m/year, for fast-flowing glaciers and ice shelves. The highest velocities are found at the Pine Island and Thwaites glaciers of West Antarctica, with rates several times those of any other glacier. This sector of the ice sheet is undergoing the most rapid change at present, over the widest area, and with the greatest impact on the total ice-sheet mass balance. Importantly, the mosaic also provides insight into preferred channels of ice transport. It reveals that every major glacier is the merger of several tributaries that extend hundreds of km inland. Of particular note, in the Antarctic peninsula, the tributaries of Wilkins Ice Shelf, and of the northern sector of George VI Ice Shelf, abruptly transition to zero velocity when they mix with the floating ice shelves, which the authors attribute to massive rates of ice-shelf melt by the underlying warm ocean.
The observation that ice flow in Antarctica is driven by a complex set of meandering, size-varying, speed-varying, intertwined tributaries, most likely dominated by basal-slip motion, challenges the traditional view of ice-sheet flow constrained by internal deformation and disconnected from coastal regions. Since this latter view has usually been adopted as the basis for continental-scale ice-sheet modelling, this new reference map will help to improve reconstructions of past and ongoing changes in Antarctica, as well as predictions of future ice-sheet evolution in a warming climate.
Future Challenges
Although satellite observations reveal significant changes occurring in the cryosphere, the causes of and processes that drive change are only partly understood. Some key questions cannot be answered with current technologies, limiting knowledge of the couplings amongst the cryosphere, oceans and atmosphere, understanding of which is key to improved predictions. Particular observational challenges include:
— Evaluating feedbacks to the ocean and atmosphere induced by changes in sea-ice cover;
— Determining the distribution, thickness, and mass balance of sea ice, and also addressing the impact of surface melt, albedo change and snow cover;
— Isolating the various contributions to ice-sheet mass balance, such as accumulation rates, melt rates and ice–ocean interactions, and evaluating their sensitivities to forcing;
— Mapping bedrock topography beneath ice sheets and ice shelves, and improving knowledge of the physical processes controlling fast glaciers and ice streams;
— Quantifying changes in snow cover, including snow water equivalent, and connections in the global hydrological cycle and regional water resources;
— Developing remote sensing techniques for characterising and monitoring permafrost regions.
Operation IceBridge
Operation IceBridge is a NASA airborne mission that began in 2009, making altimetry, radar and other geophysical measurements to monitor and characterise Earth’s cryosphere. Its primary goal is to extend the record of ice altimetry begun by ICESat. The IceBridge mission will continue until the launch of ICESat-2, scheduled for 2016.
The IceBridge mission seeks to understand the factors controlling the retreat and growth of the world’s major sea- and land-based ice sheets and their interactions with the ocean, atmosphere, solid Earth and solar radiation. Linking the altimetry measurements of ICESat and ICESat-2, as well as Europe’s Envisat and CryoSat-2, facilitates accurate intercomparisons, and the production of a long-term ice altimetry record.
IceBridge aircraft also carry radars to map and to characterise: snow and firn on land and sea-ice, to improve the interpretation of altimetry data and estimates of surface mass balance; the bedrock beneath land-based ice in Greenland and Antarctica to improve ice-sheet models; and ice layers within the ice sheets. Furthermore, the mission collects airborne gravity measurements to infer the bathymetry beneath ice shelves and sub-ice sheet bed topography beneath outlet glaciers that cannot be mapped by radar.
Taken together, these data will help to improve understanding of the mechanisms governing mass balance and the dynamics of the Greenland and Antarctic ice sheets, and those that drive sea-ice cover, particularly in the Arctic. They will also be used to validate and to improve predictive models of land-based ice contributions to sea level, and of sea ice cover, during this century.
Continuous, uniform, long-term monitoring observations are essential in assessing and understanding the response of the global cryosphere to climatic variations. Owing to large year-to-year variations in seasonal signals, the duration of monitoring records has a critical impact on the certainty with which trends can be assessed. Data gaps could also significantly impair our ability to track down rapid events, such major calving events, ice shelf collapse, glacier draw down or exceptional melt seasons. The recent conclusions of the ICESat, ALOS and Envisat missions, combined with the limited remaining lifetimes of the RADARSAT-2 and GRACE satellites, represent a significant challenge to the various space agencies tasked with maintaining these long-term times series of measurements. This effort would be strengthened by the continued operation of RADARSAT-2 and CryoSat-2. From 2014, ESA will launch two Sentinel satellites to complement the radar altimetry and SAR data records begun by ERS-1, and Japan will launch its ALOS-2 satellite. Furthermore, NASA has committed to extending the unique datasets established by ICESat and GRACE, scheduling launches of the ICESat-2 and GRACE follow-on satellites in 2016 and 2017, and has initiated studies for the development and eventual launch of the DesDynI SAR satellite.
Finally, the vast amount of data being collected by cryosphere-observing satellites poses its own challenges in stewardship, especially ensuring usability by a broad user community to understand the couplings of the cryosphere to the global climate system. But most importantly, concerted effort is needed to make these data freely available to scientists who can interpret the state of the cryosphere, and help to improve predictions of the state of the future Earth.
Figure 5. Antarctic ice velocity derived from ALOS PALSAR, Envisat ASAR, Radarsat-2 and ERS 1/2 satellite interferometry, overlaid
on a MODIS mosaic of Antarctica. Thick black lines delineate ice
divides. Thin black lines outline a selection of sub-glacial lakes
(courtesy Science).