|
|
|
| THE BIG THAW |
|
|
|
|
Ice plays an important role in the regulation of the Earth's climate in a number of ways:
— a certain percentage of the solar radiation reaching the Earth’s atmosphere and surface is reflected back out to space. The percentage of sunlight that is reflected depends on the albedo (reflectivity) of the surface. Ice and snow have a high albedo and hence reflect about 80% of incident sunlight. Once formed, ice tends to be maintained. However, if ice cover decreases, less solar radiation is reflected from the surface of the Earth and, as a result, the atmosphere absorbs more heat;
— each year, the Arctic and the Antarctic Oceans experience the formation and then melting of vast amounts of floating sea ice. At the North Pole, an area of ice the size of Europe melts away every summer and then freezes again the following winter. The thickness of this sea ice plays a central role in polar climate as it moderates ocean-atmosphere heat exchange by insulating the ocean from the cold polar atmosphere;
— the distribution and duration of seasonal growth and melt of polar sea ice have a significant effect on the global ocean circulation pattern – known as thermohaline circulation. As the ice melts, causing an influx of fresh water into the surrounding ocean, the salinity and density of the water decrease. Conversely, as ice is formed, the salinity and density of the surface water increase. This causes the surface waters to sink, effectively driving deep ocean currents from the polar regions towards the equator. This outflow is balanced by a surface inflow of warmer, less dense water masses from low to high latitudes. The Gulf Stream, which carries warm surface water northwards from the Gulf of Mexico to the sub-polar latitudes east of Greenland, is extremely important in moderating the climate in Europe; the coastal waters of Europe are 4°C warmer than waters at the equivalent latitude in the North Pacific. However, the warm waters of the Gulf Stream cool and sink as they reach the Arctic. If this circulation pattern is disturbed in future by a dramatically reduced cover of seasonal Arctic sea ice, this may have a profound effect on the strength or direction of the Gulf Stream. It is, therefore, apparent that an improved knowledge of the fluxes of sea ice in the Arctic and their consequences for the thermohaline circulation is important for the prediction of Europe’s climate, and would have global implications |
|
 |
|
|
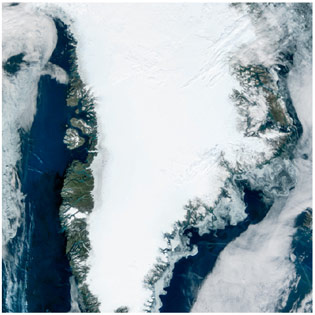
| — continental ice has an impact on sea level. The ice sheets covering Antarctica and Greenland amount to about 28 million km3, which means that the sea level is about 65 m lower than it would be if all this ice melted. There are indications that changes are occurring at the margins of the ice sheets and it is these apparent changes that need to be quantified. |
|
 |
|
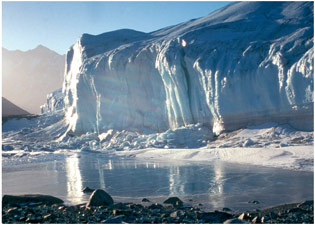
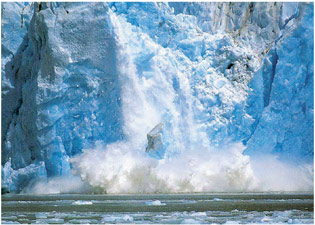
On a smaller but no less important scale, glaciers play a significant role in regional hydrology and climate, since evidence suggests the majority of the world’s glaciers are currently undergoing melting. Almost 80% of the Earth’s fresh water is locked up in the cryosphere (snow, ice and permafrost). The IPCC’s recent 4th assessment (discussed in Part I of this document) indicates that melting glaciers will initially increase flood risk and then strongly reduce water supplies, eventually affecting one-sixth of the world’s population – predominantly in the Indian sub-continent, parts of China, and the Andes of South America. Given the important influence of the cryosphere on the climate system, and its predicted impacts on sea level, global warming, ocean circulation and freshwater availability, a thorough understanding of the state of the cryosphere is central to our ability to predict and adapt to climate change.
The Role of Satellites
The long-term, wide-area observations carried out by Earth observation satellites provide authoritative evidence of trends in the cryosphere – including glaciers and the polar ice caps – and enable estimation of the consequences should melting continue into the future. The poles are amongst the Earth’s most inaccessible areas, so obtaining measurements of sea ice was difficult before the advent of satellites. Since the 1970s, routine, all-weather, day-and-night, (passive microwave) observations, supported by available visible imagery and estimates of air temperature from weather forecasting models, have contributed to climate data records. They have revealed a dramatic decline of about 3% per decade in Northern Hemisphere sea ice cover. More recently, scatterometer instruments on European, American and Japanese satellites have augmented the passive microwave records. Together with buoy data, they have been used to monitor ice drift, and to understand seasonal to interannual variations in sea ice growth and melt processes.
For the ice sheets and glaciers, key sensors have been synthetic aperture radar (SAR) and satellite altimeters, with major contributions from the 19-year record provided by the ERS-1, ERS-2 and Envisat satellites. SAR has been used to map the ice sheets with unprecedented detail and has demonstrated the impact of streaming ice flow for the regional ice sheet mass balance, as well as the critical importance of the rate of ice stream flow and ice shelf decay to the overall stability of the large ice sheets.
In conjunction with SAR observations, altimeter time series have characterised seasonal to inter-annual changes in ice sheet elevation and topography over moderately sloping regions from basin to continental scale. These data indicate that, although the central parts of the large ice sheets appear stable and in balance, dramatic changes are taking place around their more dynamic margins, in particular around the West Antarctic ice sheet and Greenland. The dramatic disintegration of ice shelves, such as the Larsen shelf in Antarctica, indicate that the ice sheet and ice shelf dynamics may be considerably more sensitive to short-term climate fluctuations than formerly believed.
|
|
|
 |
|
|
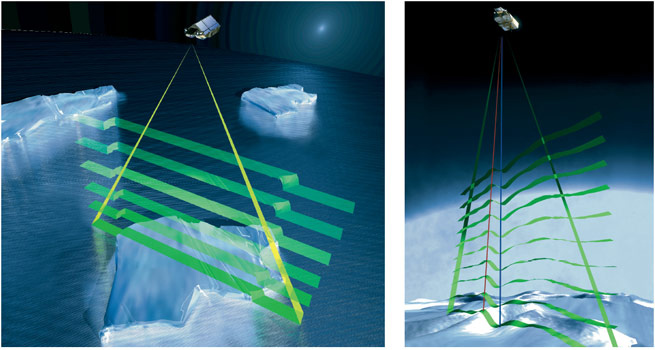
CryoSat is able to measure the freeboard (height by which the ice rises above the
water surface) of floating sea ice with its sensitive altimeter. From the freeboard,
the ice thickness can be estimated if the density of the sea ice is known. |
|
Over topographic surfaces, the first radar echo comes
from the nearest point to the satellite. CryoSat can
measure the angle from which this echo originates, so
that the source point can be located on the ground. This,
in turn, allows the height of that point to be determined. |
|
|
|
|
The combination of SAR and satellite altimetry is helping to determine the mass balance of ice sheets, although not yet to the level required to be confident about their overall stability. New insights are also being provided by the satellite gravity surveys of the Gravity Recovery and Climate Experiment (GRACE) mission, which provides separate estimates of ice mass. Additional information, such as ice thickness, is needed to advance the knowledge of ice flow dynamics.
Satellites observe the rapid decrease in glacier area worldwide, but better data on mass balance and volume changes are needed to fully understand the climate response and their impact on hydrology and water resources.
The long-term passive microwave records, and the more recent scatterometer and SAR data, indicate that snow seasonally covers up to 30% of the land surface. Snow cover changes therefore exert a large influence on both the radiation and freshwater balances. As global warming proceeds, it is predicted that regions currently experiencing snowfall will increasingly receive precipitation in the form of rain, and for every 1oC increase in temperature the snowline will rise by about 150 metres. Perennially frozen ground (i.e. permafrost) is estimated to underlie 24% of the exposed Northern Hemisphere land area. Permafrost has an important regulative function on the exchange of carbon and other gases between the land and the atmosphere. Fluxes of gases from northern ecosystems represent a highly uncertain contributor to future global change, and in situ observations suggest that global warming will strongly modify these fluxes. |
|
|
The wet lowlands of the Arctic permafrost landscapes, for example, are important natural sources of the greenhouse gas methane. Recent satellite observations have detected accelerated melting of Siberian bogs, which may unleash significant amounts of methane, thereby amplifying global warming. Continuous observations of permafrost extent and characteristics are needed to assess the role of the permafrost regions in climate change. Scatterometers and SAR have been used to observe the characteristics of permafrost areas, but more systematic observations at high spatial resolution are needed.
Given the significance of the cryosphere in our study of the Earth’s climate, both ESA and NASA have sought to provide specialised cryosphere satellite missions in recent years. The ICESat (Ice, Cloud, and Land Elevation Satellite) mission, part of NASA’s Earth Observing System, measured ice sheet mass balance, cloud and aerosol heights, as well as land topography and vegetation characteristics. ICESat was launched in January 2003 and flew until September 2010. A follow-on, ICESat-2, is planned for launch in 2015. The European CryoSat mission was lost as a result of a launch failure in October 2005. Due to the importance of the scientific goals of this satellite, there was enormous support for re-flying the mission and CryoSat-2 was launched by ESA in April 2010. |
|
|
 |
|
|
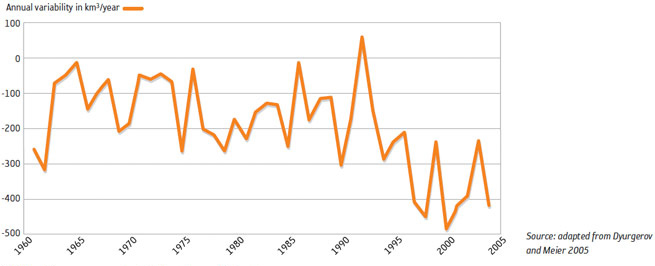
Global glacier mass: annual variability and cumulative values. |
|
|
|
|
Future Challenges
The overriding objectives are to quantify the impacts of climatic variability and change on the cryosphere, and to assess the consequences of these changes for the climate system and the environment as a whole. Although satellite observations have revealed significant changes taking place to the cryosphere, the attribution of these changes to either anthropogenic or natural causes remains unclear. Key measurements are not yet available, which limits our ability to characterise the overall behaviour of major elements of the cryosphere and to assess the nature of its interaction with the oceans, atmosphere and terrestrial systems. Particular observational challenges include:
— the mass, freshwater balance and distribution of sea ice, as well as current and possible future feedbacks to the ocean and atmosphere; |
|
|
— the mass balance of ice sheets, ice caps and glaciers, to assess their contribution to sea level, and to evaluate their sensitivity to forcing;
— changes in snow water equivalent and solid precipitation, and their impacts on the global hydrological cycle and regional water resources.
Continuous, uniform, long-term monitoring observations are the key to assessing the response of the global cryosphere to climatic variations. Due to large year-to-year variations in seasonal signals, the duration of monitoring records has a critical impact on the certainty with which trends can be assessed. Meanwhile, high resolution temporal and spatial observations are needed to characterise rapid variations in snow and ice in response to surface processes. |
|
|
 |
|
|
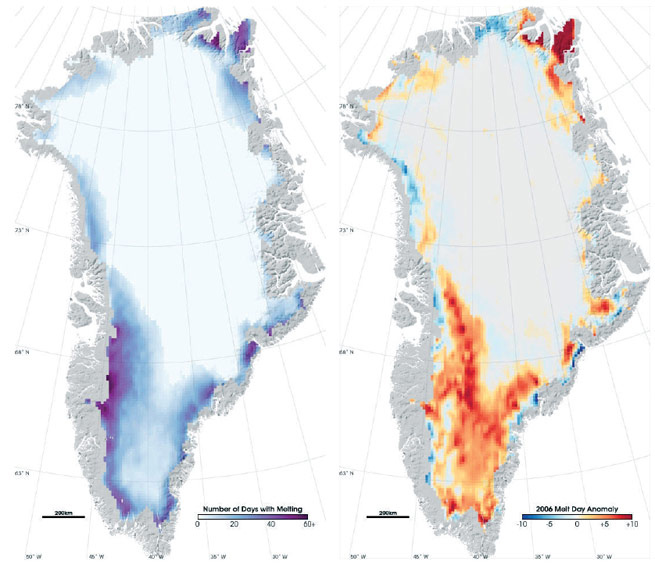
Maps based on satellite imagery showing the number of days in 2006 when melting occurred.
The dark blue areas had the most days of melting.
The number of days when melting took place in 2006 was more than the average between 1988 and 2005.
The dark red areas indicate the number of days above the average.
(Credit: NASA/Robert Simmon and Marit Jentoft-Nilsen) |
|
|
|
|
To address these observational requirements effectively, a combination of routine, broad swath, low resolution, global monitoring instruments (microwave and optical) and specialised, high resolution, narrow swath data are required. New findings from current and forthcoming satellite observations, combined with more routine observations from present and future SAR, scatterometer and passive microwave missions, will advance our ability to sustain the optimum satellite observing system for the cryosphere.
The IGOS Cryosphere Theme is a combined initiative of the World Climate Research Programme (WCRP) Climate and Cryosphere (CliC) Project and the Scientific Committee on Antarctic Research (SCAR). |
|
|
The Theme creates a framework for improved international coordination of cryospheric observations that will result in a more comprehensive, coordinated, and integrated cryosphere observing system. It will facilitate the flow of data and information in cryospheric research, long-term scientific monitoring, and operational applications. Many recommendations of the Cryosphere Theme will be implemented as part of the Group on Earth Observations (GEO) work plan. The 15th WMO Congress in May 2007 approved the proposal to initiate the establishment of a Global Cryosphere Watch, based on IGOS Cryosphere recommendations. |
|
|
 |
|
|
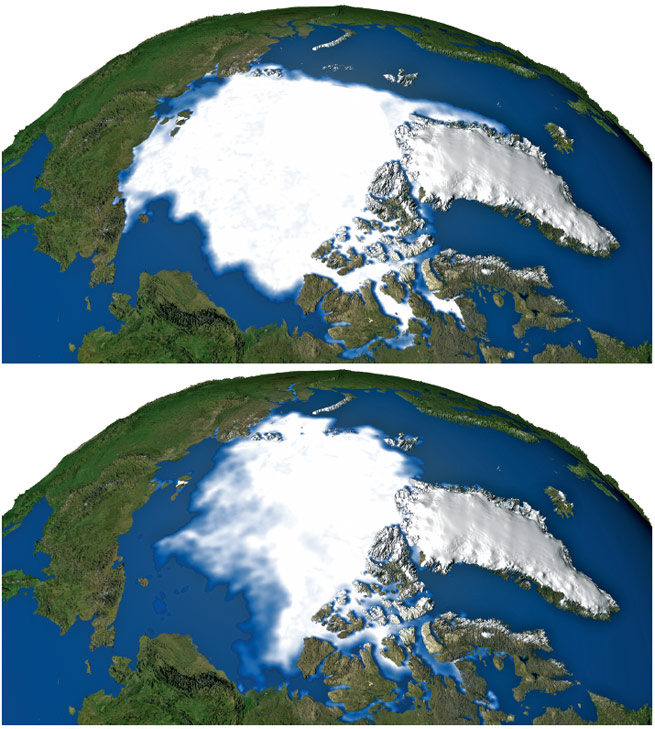
Comparison of sea ice from 1979 and 2003. |
|
|
|
|
The International Polar Year is a large scientific programme focused on the Arctic and Antarctic from March 2007 to March 2009. IPY, organised through the International Council for Science (ICSU) and the World Meteorological Organisation (WMO), is actually the fourth Polar Year, following those in 1882–3, 1932–3, and 1957–8. |
|
|
In order to have full and equal coverage of both the Arctic and the Antarctic, IPY 2007–8 actually covers two full annual cycles from March 2007 to March 2009 and involves over 200 projects, with thousands of scientists from over 60 nations examining a wide range of physical, biological and social research topics. |
|
|
|
|
CryoSat-2
CryoSat-2 was launched in April 2010 with a planned three-year mission is to survey natural and human-driven changes in Earth’s
cryosphere. It is designed to provide much more accurate data on the rate of change of the surface
elevation of the polar ice sheets and sea ice thickness. From a near-polar orbit of just over 700 km
altitude that reaches latitudes of 88°, CryoSat-2 monitors precise changes in the thickness of the
polar ice sheets and floating sea ice, hopefully providing conclusive evidence of the rates at which ice cover is diminishing.
Fundamentally, there are two types of polar ice – marine ice that grows and floats in the oceans and the
ice that lies on land. Not only does the melting of these forms of ice have different consequences for our
planet and its climate, they also pose different challenges when trying to measure them from space.
Floating sea ice is relatively thin – up to a few metres thick – but it influences regional temperature and
the circulation of ocean currents, and consequently the Earth’s climate. CryoSat-2 acquires precise
measurements of the thickness of floating sea ice so that annual variations can be detected.
In contrast, the ice sheets that blanket Antarctica and Greenland are several kilometres thick. It is the
growth and shrinkage of these ice masses that have a direct influence on sea level. The chosen approach
to measuring these vast thicknesses is to determine the height of the surface accurately enough to
detect small changes. The current constraints are overcome by the altimeter on
CryoSat-2, which exploits sophisticated radar techniques to improve resolution and observing
capabilities.
The primary instrument is the SIRAL (SAR / Interferometric Radar Altimeter). SIRAL operates in one of
three modes, depending on the type of surface over which the satellite is flying. Over the oceans and ice
sheet interiors, CryoSat operates like a traditional radar altimeter. Over sea ice, transmitted echoes are
combined (using synthetic aperture processing) to reduce the surface footprint so that smaller ice floes
can be mapped. The most advanced mode is for the ice sheet margins and mountain glaciers, when the
altimeter performs synthetic aperture processing and uses a second antenna to determine the
across-track angle to the earliest radar return. This provides the precise location of the area being
measured when the surface is sloping.
|
|
|
|
|
|
|